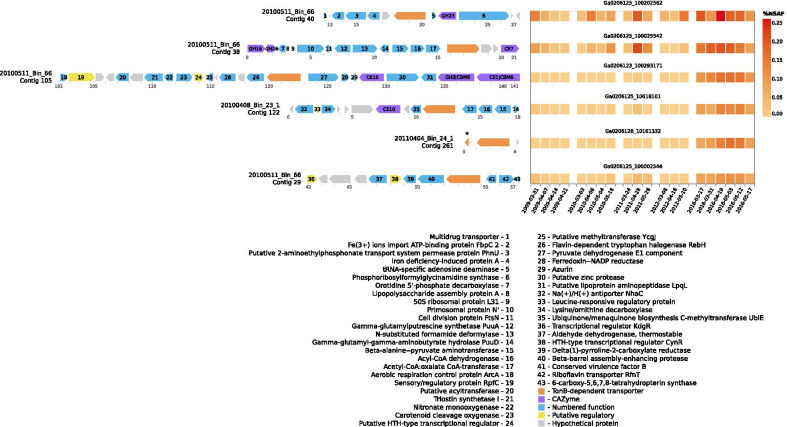
Fig. 3.
Six most abundant TonB-dependent transporters in metaproteomic data belonging to the SAR92 species with representative genome 20110523_Bin_31_1 (heatmap, right), with their genomic contexts (arrow plots, left). Metaproteome data is presented as normalised spectral abundance factor (%NSAF), which indicates abundance of a protein as a percentage of all protein in a sample. Gene arrangements are
taken from several genomes belonging to this species, based on length of contig on which the gene was assembled. The fifth most abundant was present in only two genomes, on very short contigs. The asterisk (*) indicates which TBDT is represented in the metaproteome data. The abundance pattern in the metaproteome suggests that these contigs were not mistakenly assigned to this species, however. Numbers below arrows indicate position on contig in kilobase pairs

