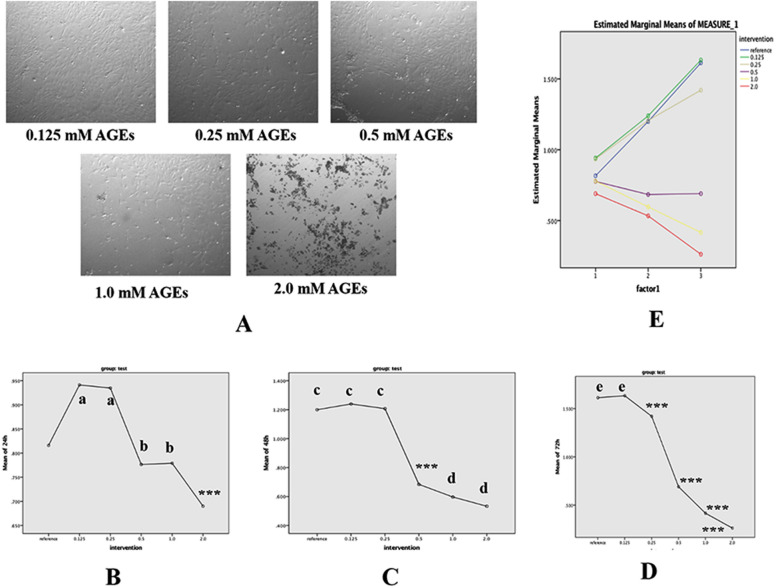
Fig. 2.
Effect of AGEs on cell viability of BMSCs. A Effects of different concentrations of AGEs on the differentiation of BMSCs. B Effects of different concentrations of AGEs on the differentiation of BMSCs for 24 h. C Effects of different concentrations of AGEs on the differentiation of BMSCs for 48 h. D Effects of different concentrations of AGEs on the differentiation of BMSCs for 72 h. E Effects of action time and concentration of AGEs on cell vitalities of BMSCs. Images (100× magnification) are representative images of three independent samples. Data are expressed as means ± SD. ***P < 0.001; a, b, c, d, eP < 0.001 vs. control group (ANOVA, F = 20.8–157.7)

