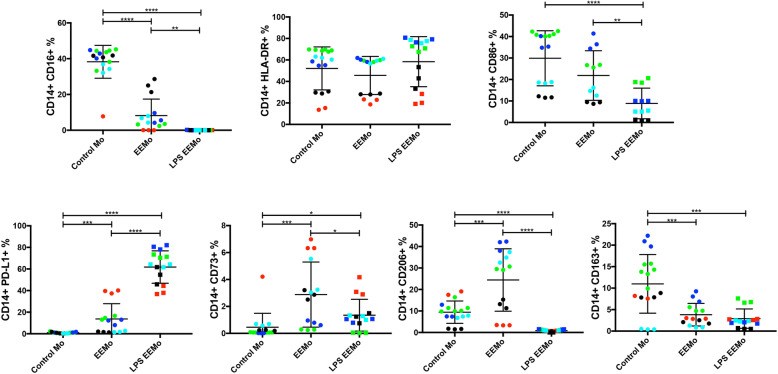
Fig. 3.
LPS-EEMos show an increased percentage of PD-L1+ cells and decreased percentage of CD16+ and CD86+ cells. Monocytes from 4 isolates (color coded) were either untreated control monocytes (Mo), educated for 24 h with either unprimed MSC exosomes (EEMo), or LPS-primed MSC exosomes (LPS-EEMo). After education, monocytes were stained for flow cytometry. The percent (%) CD14+ cells for each marker (± SEM) is shown. Results pooled from 2 separate experiments, with 4 to 13 samples/group. Groups were compared by Kruskal-Wallis with a Dunn post-test. *p ≤ 0.05, **p ≤ 0.005, ***p ≤ 0.0005, ****p ≤ 0.0001 between groups

