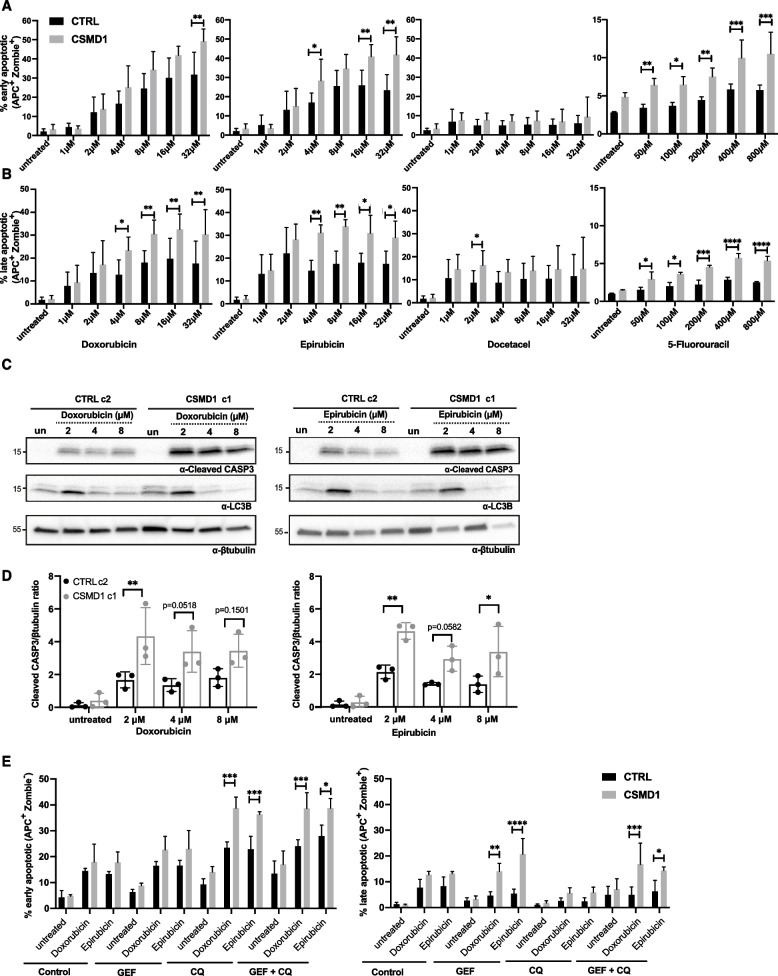
Fig. 5.
CSMD1-expressing BCCs are sensitive to chemotherapy. MDA-MB-231 CTRL and CSMD1 cells were treated with different chemotherapy agents for 48 h, and apoptosis was monitored using annexin V staining while live/dead cell discrimination was performed with Zombie Aqua staining, both using flow cytometry. Bar graphs showing percentages of (A) early and (B) late apoptotic cells. C Immunoblot analysis of cleaved caspase-3 and LC3B upon treatment with different chemotherapy agents; β-tubulin was used as a loading control. D Densitometry analysis of cleaved caspase-3 normalized to β-tubulin. E MDA-MB-231 CTRL and CSMD1 cells were pre-treated with GEF, QC alone and combination of both for 24 h, following doxorubicin and epirubicin (1 μM) treatment for 48 h. Bar graphs showing percentages of early and late apoptotic cells. All experiments were repeated at least 3 times with bars indicating mean ± SD, grey circles correspond to independent data points for CTRL and CSMD1 groups, respectively. A two-way ANOVA Bonferroni’s multiple comparisons test was used when comparing CTRL and CSMD1 groups in different concentration of chemotherapy drugs or treatments

