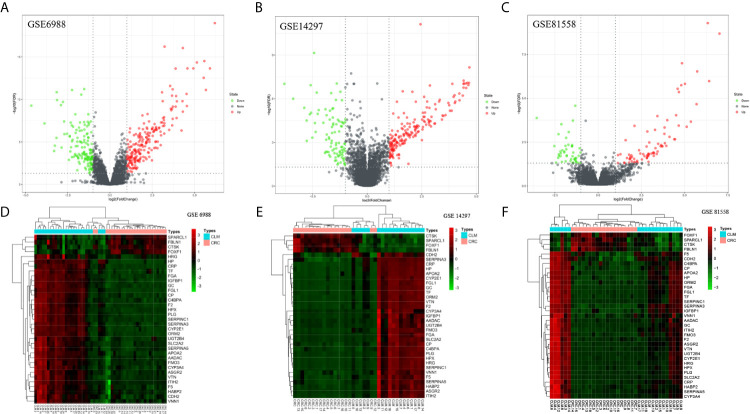
Figure 1.
Distributions of differentially expressed genes in CRC and CLM (|log2FC| >1 and adjusted P-value < 0.05) in 63 pairs of matched colorectal primary cancer and liver metastatic tissues. These were volcano maps and heatmaps of 3 data sets, included GSE6988 (A, D), GSE14297 (B, E), and GSE81558 (C, F) data set. Red stands for upregulations, green stands for downregulations and black stands for normal expression in volcanoes. Each point represents a gene.

