Figure 4.
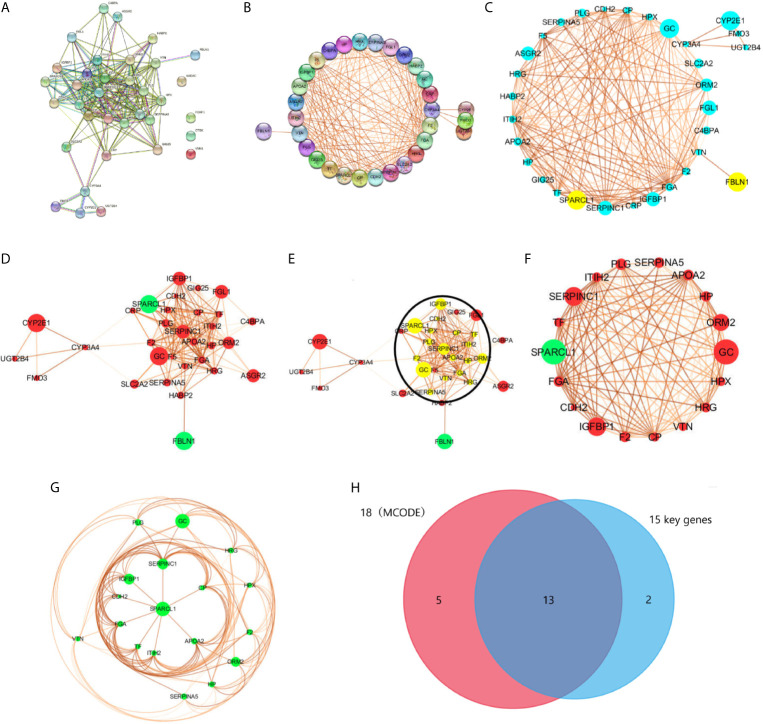
PPI network was visualized in STRING and CYTOSCAPE. (A) The PPI network was visualized in STRING that contained 35 nodes and 189 edges, with an average node degree of 10.8, and an average local clustering coefficient of 0.66 with a PPI concentration p-value less than 1.0e-16. (B) Four out of 35 DEGs (AADAC, FOXF1, CTSK, and VNN1) did not fall within the PPI network. (C, D) PPI network of 31 DEGs was visualized in CYTOSCAPE, yellow and green in the node means down regulation, blue and red represents up regulation. The thickness of the node connecting line represents the size of the comparison score. Module analysis of DEGs enrolled in PPI network with the criterion degree cutoff = 2, node score cutoff = 0.2, k-core=2, max depth = 100. The yellow dot in the circle in (E) were modular nodes through MCODE analysis. (F, G) MCODE Genes were visualized in CYTOSCAPE, included 18 nodes and 119 edges. (H) Intersection of 18 modular genes in MCODE and 15 key genes in STRING.

