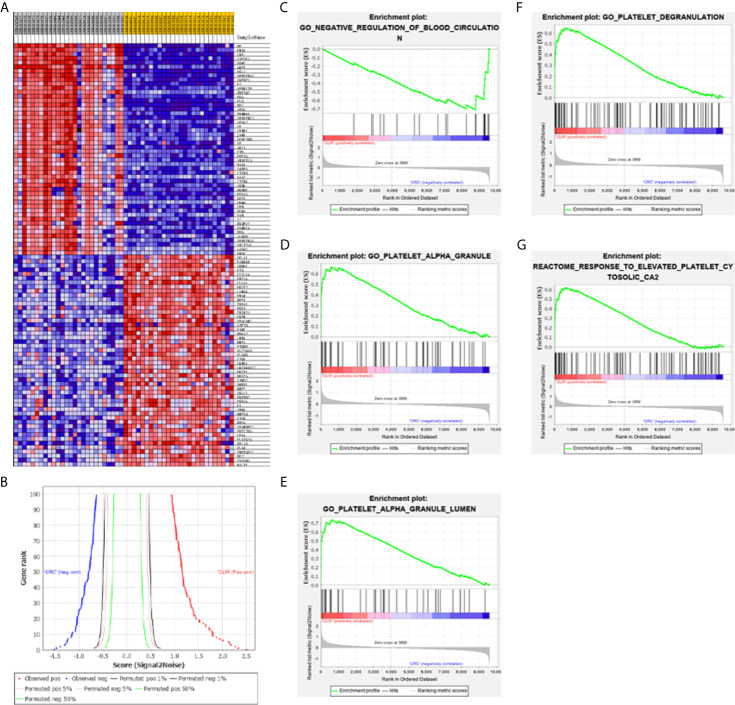
Figure 5.
(A) GSEA software are used to create a heat map of the top 50 genes with high expression levels in the CLM and CRC phenotypes in GSE6988 (the color range is from “red-blue” to show the range of expression values as “high to low”). (B) This figure shows the positive correlation (left) and negative correlation (right) between gene grade and ranking index score. (C–G) GSEA analysis about blood circulation and platelet activation-related gene profiles based on CLM and CRC phenotypes in TCGA database.

