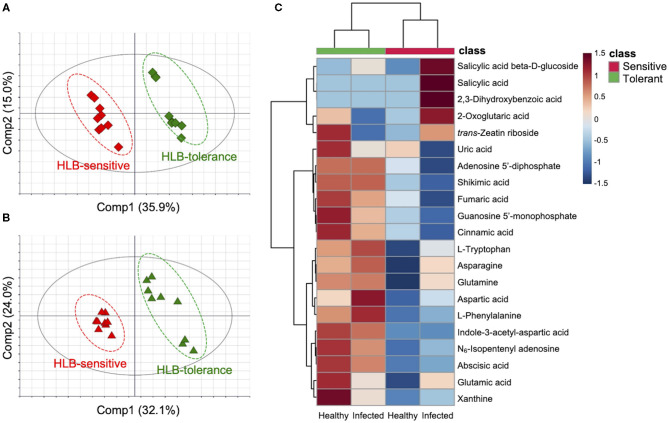
Figure 1.
Metabolic differences between Huanglongbing (HLB)-tolerant (Sugar Belle®) and HLB-sensitive (‘Murcott’) citrus cultivars (n = 9). Partial least squares discriminant analysis score scatter plots of (A) healthy and (B) infected groups including HLB-tolerant samples (green) and HLB-sensitive samples (red). (C) Hierarchical clustering heat map of metabolites in four groups (healthy and infected HLB-tolerant and HLB-sensitive samples). All visualized metabolites are marker compounds [Variable importance in projection (VIP) score > 1.0, p-value < 0.05, and |fold change| > 1.5] involved in the pivotal pathways biosynthesis of plant hormones (BPH), aspartate and glutamate metabolism (AGM), and purine metabolism (PM)] related to HLB tolerance. The color depth of the heat map represents the degree of metabolic responses as follows: red color denotes increased responses and blue color denotes decreased responses.

