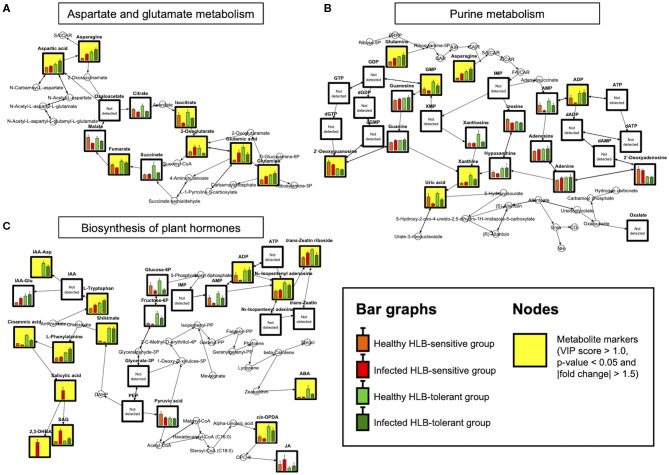
Figure 2.
Metabolite mapping on (A) AGM (B) PM, and (C) BPH pathways (n = 9). Bar graphs show metabolite levels with SE in healthy HLB-sensitive group (orange), infected HLB-sensitive group (red), healthy HLB-tolerant group (light green), and infected HLB-tolerant group (green) based on the integrated results. Yellow background indicates marker compounds (VIP score > 1.0, p-value < 0.05, and |fold change| > 1.5) in the pathways.

