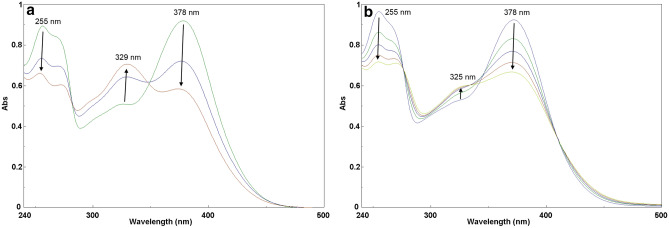
Fig. 6.
UV–VIS spectra of quercetin under autoxidation (a) and chlorination (b) (in the presence of 0, 25, 50, 100, and 150 μM HOCl) in ethanol/PBS mixture (30%/70%), pH 7.4, the flavonoid concentration was 50 μM, the temperature of autoxidation was 50 °C, 1-h interval, the temperature of chlorination was 25 °C, 1 min of incubation with HOCl

