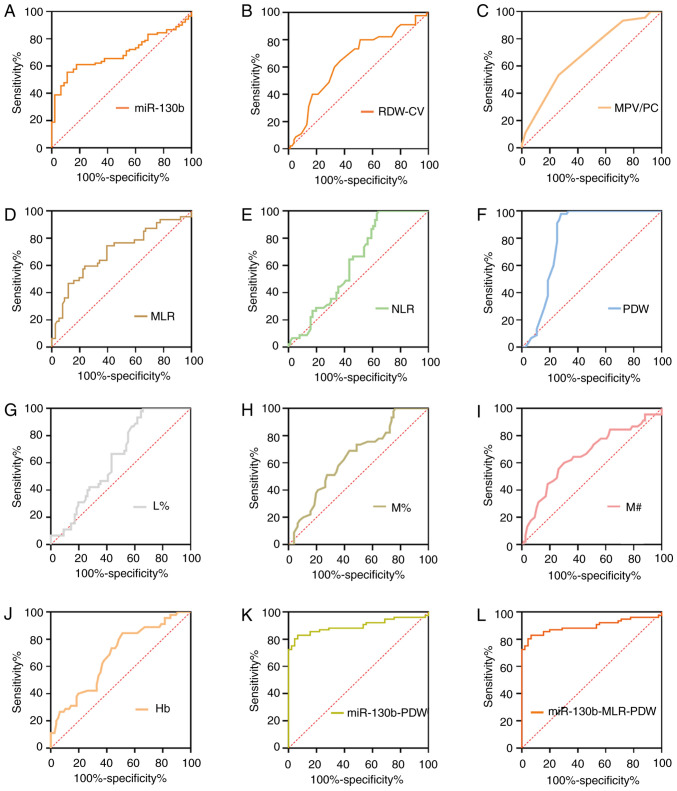
Figure 7.
ROC curve analyses of circulating biomarkers for Pres. ROC analysis for detection of Pres using (A) miR-130b, (B) RDW-CV, (C) MPV/PC, (D) MLR, (E) NLR, (F) PDW, (G) L%, (H) M%, (I) M#, (J) Hb, (K) miR-130b-PDW and (L) miR-130b-MLR-PDW. Hb, hemoglobin; L%, lymphocyte percentage; miR-130b, microRNA-130b; MLR, monocyte to lymphocyte ratio; MPV/PC, mean platelet volume to platelet count ratio; M%, monocyte percentage; M#, monocyte count; NLR, neutrophil to lymphocyte ratio; PDW, platelet distribution width; RDW-CV, red blood cell distribution width-coefficient of variation; ROC, receiver operating characteristic; Pres, precancerous gastric lesions.

