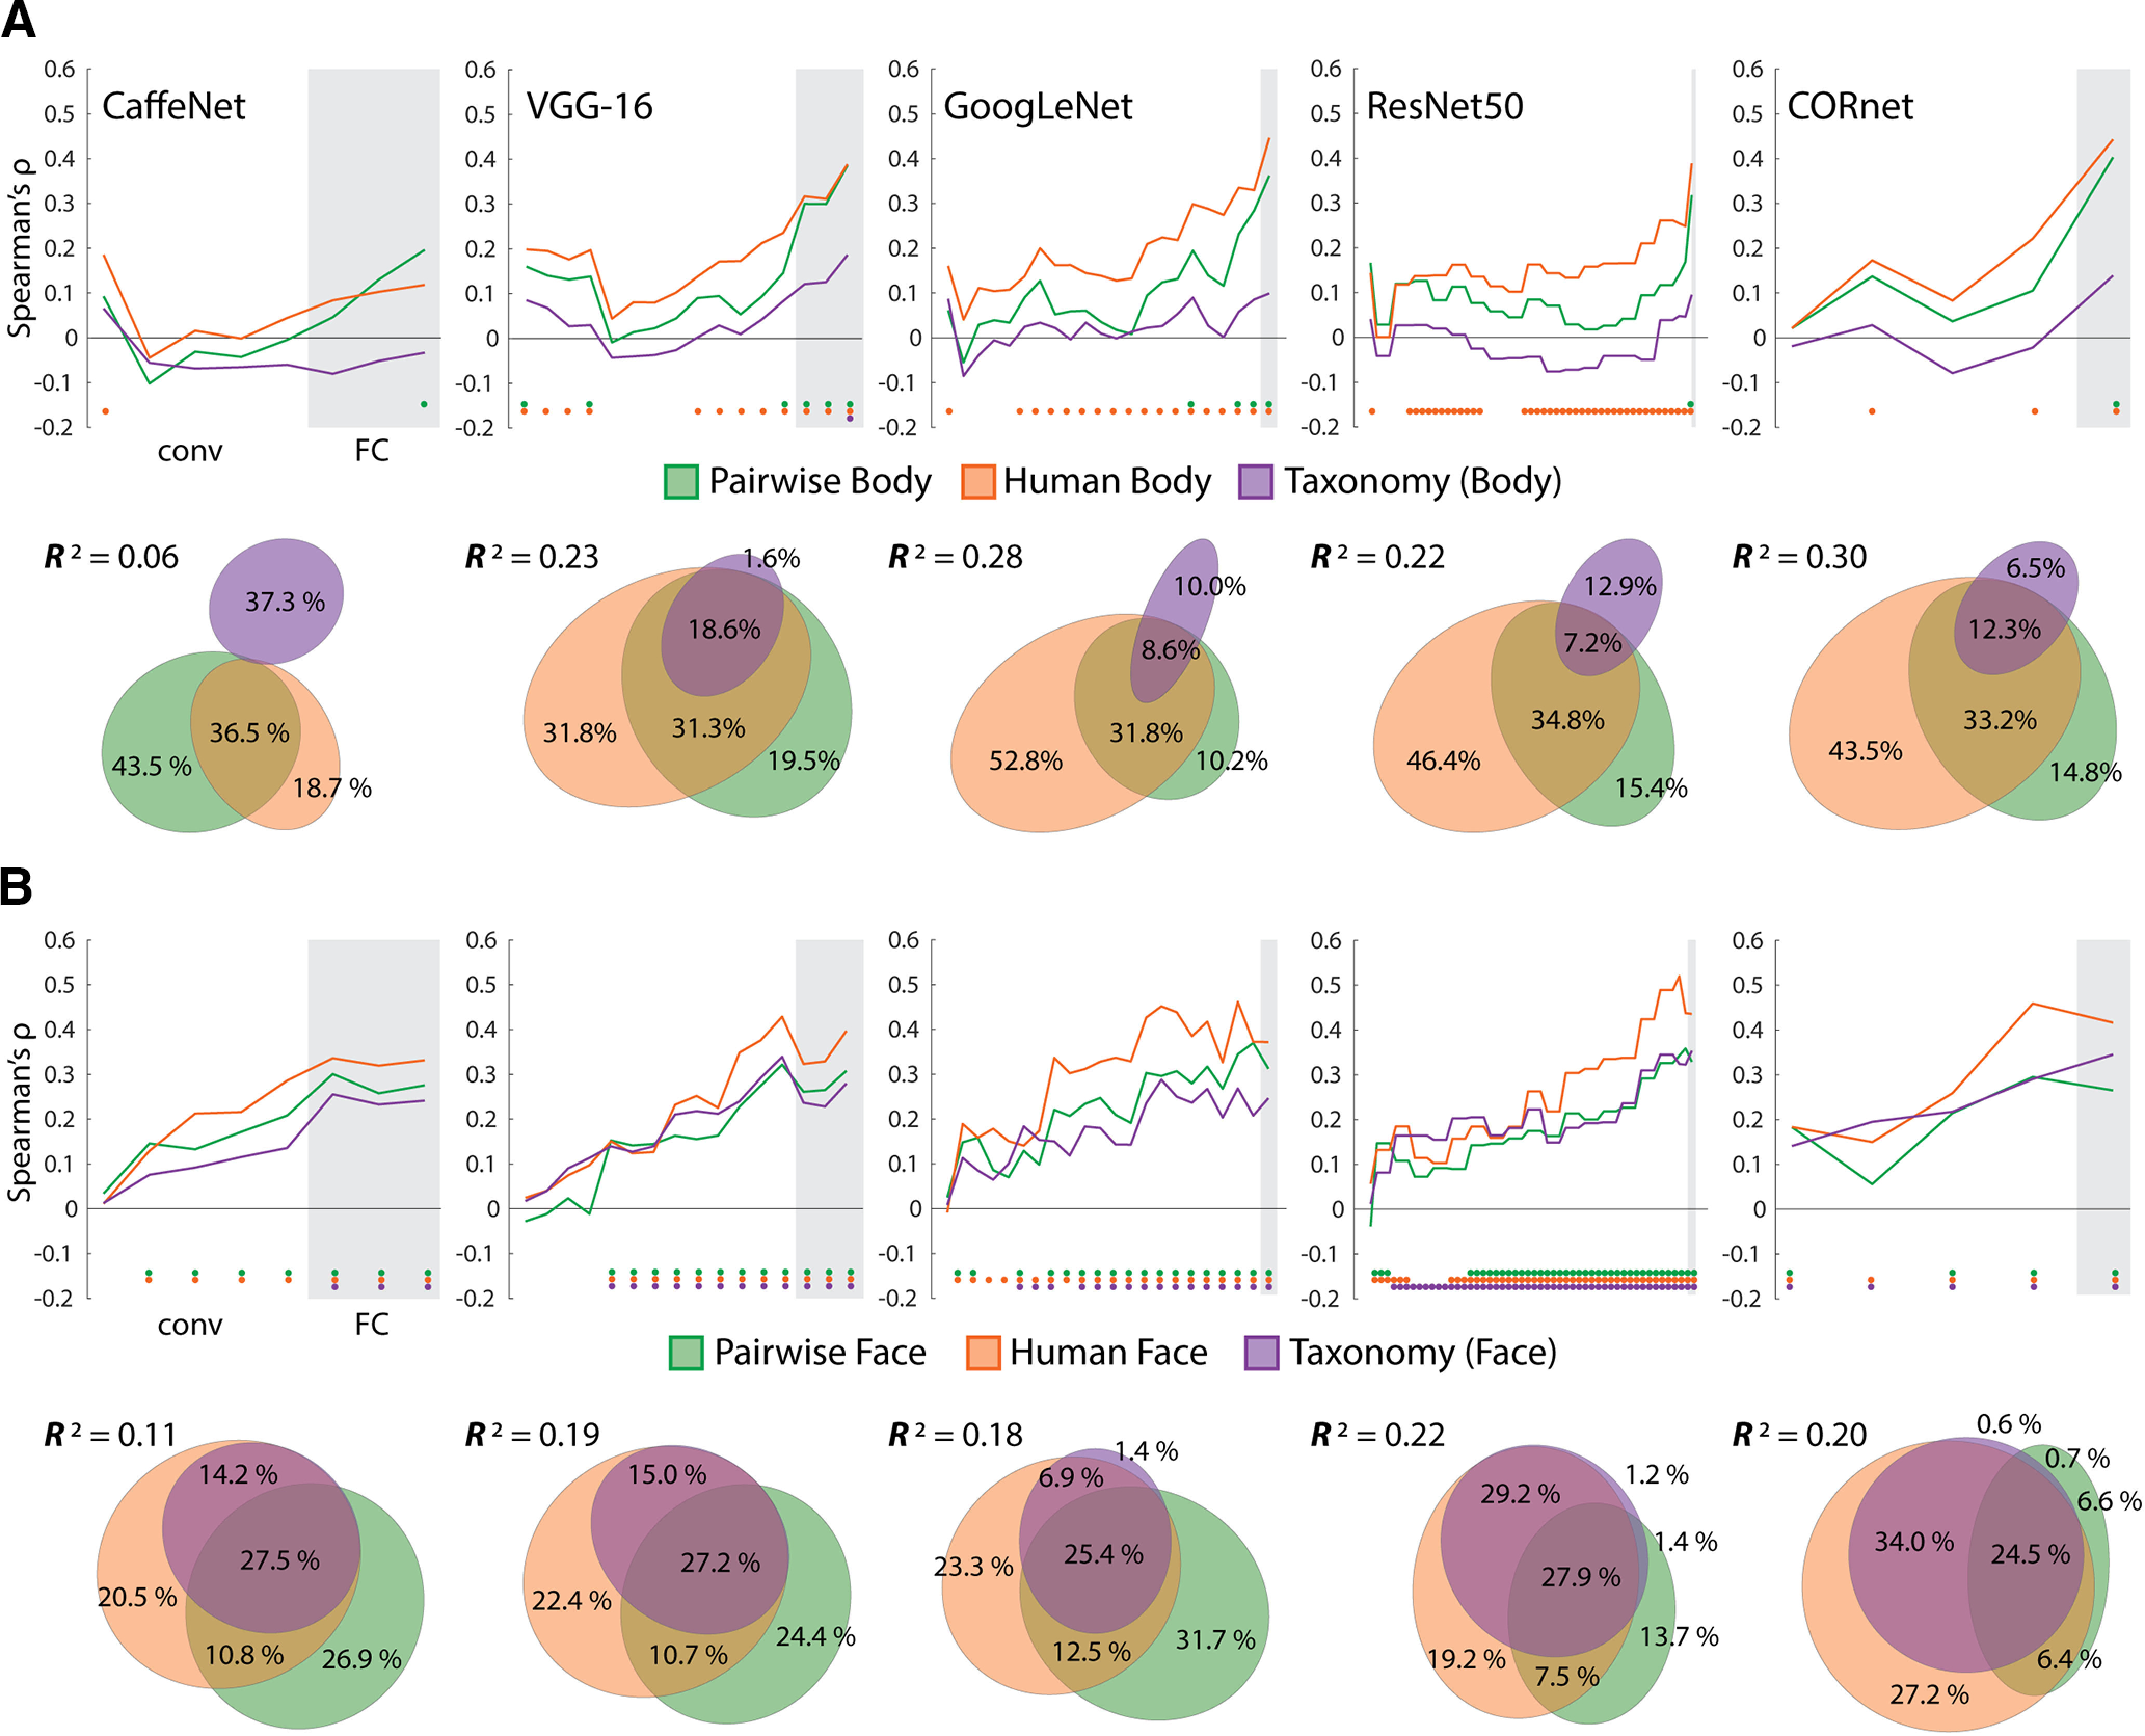
Figure 10.

Results of comparing models for face and body images to DNNs. A, The layers of each of the five networks were correlated with each of the body image RDMs. Color-coded dots indicate significant (positive) correlations at p < .05 (FDR adjusted), based on two-sided permutation tests. Results of commonality analysis for the final layers of all networks are shown with Euler diagrams. B, Correlations between the layers of the five networks and the three model RDMs for the face images. All conventions are the same as in A. For both A and B Gray areas indicate FC/decoding layers for each network and are preceded by the conv/area layers.
