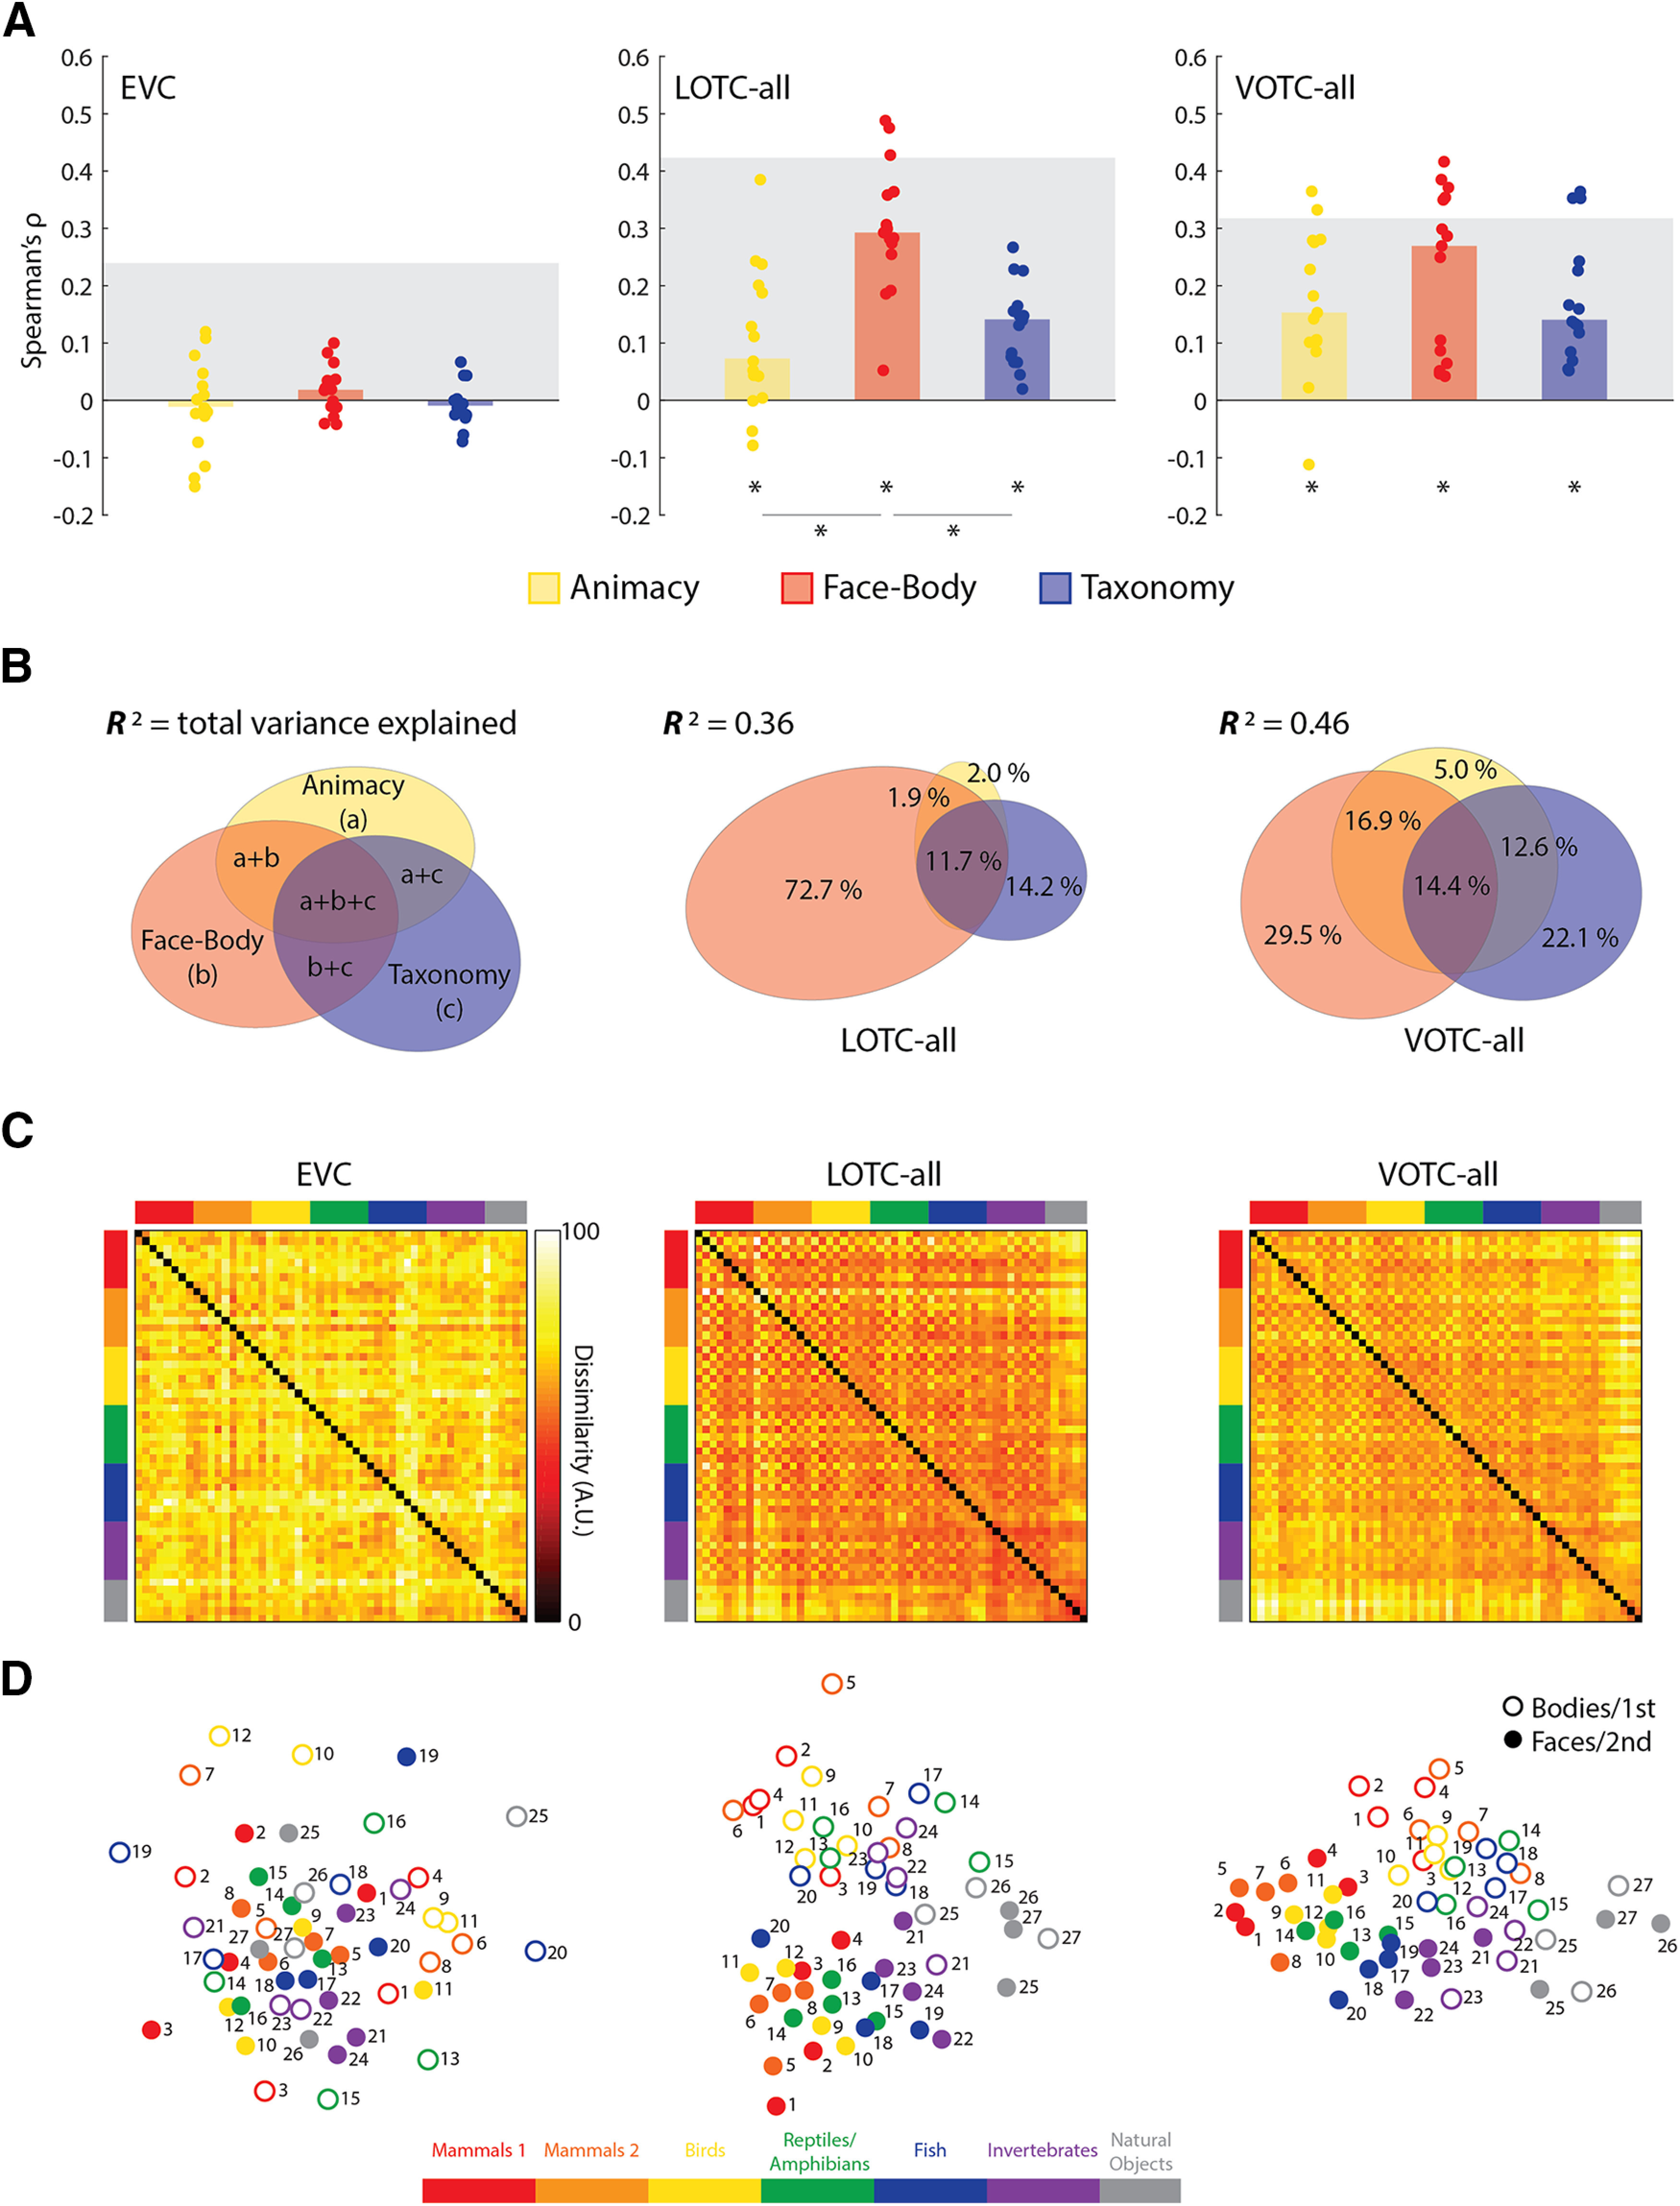
Figure 2.

Comparing the main model RDMs to the EVC, LOTC-all, and VOTC-all. A, Bar charts indicating the median Spearman's ρ rank-order correlations between neural RDMs for individual subjects (dots) and model RDMs. Gray blocks indicate the noise ceiling. *p < 0.05. B, Results of commonality analysis for the LOTC-all and VOTC-all, depicted with Euler diagrams. A schema of the unique and common variance components is also depicted. Coefficients of determination (R2) indicate the total proportion of explained variance for the full model. Regions of the Euler plots indicate percentages of the explained, and not total, variance accounted for by each component. C, Group-averaged neural RDMs with the axes color coded based on the taxonomic hierarchy. Dissimilarity values are scaled to range 0–100. D, Two-dimensional multidimensional scaling applied to the dissimilarity matrices. Points are color coded to reflect the taxonomic hierarchy and are either rings or dots to reflect the face/body division, or the first/second item for each natural object type. Numbers indicate individual animals or natural object type based on Figure 1A.
