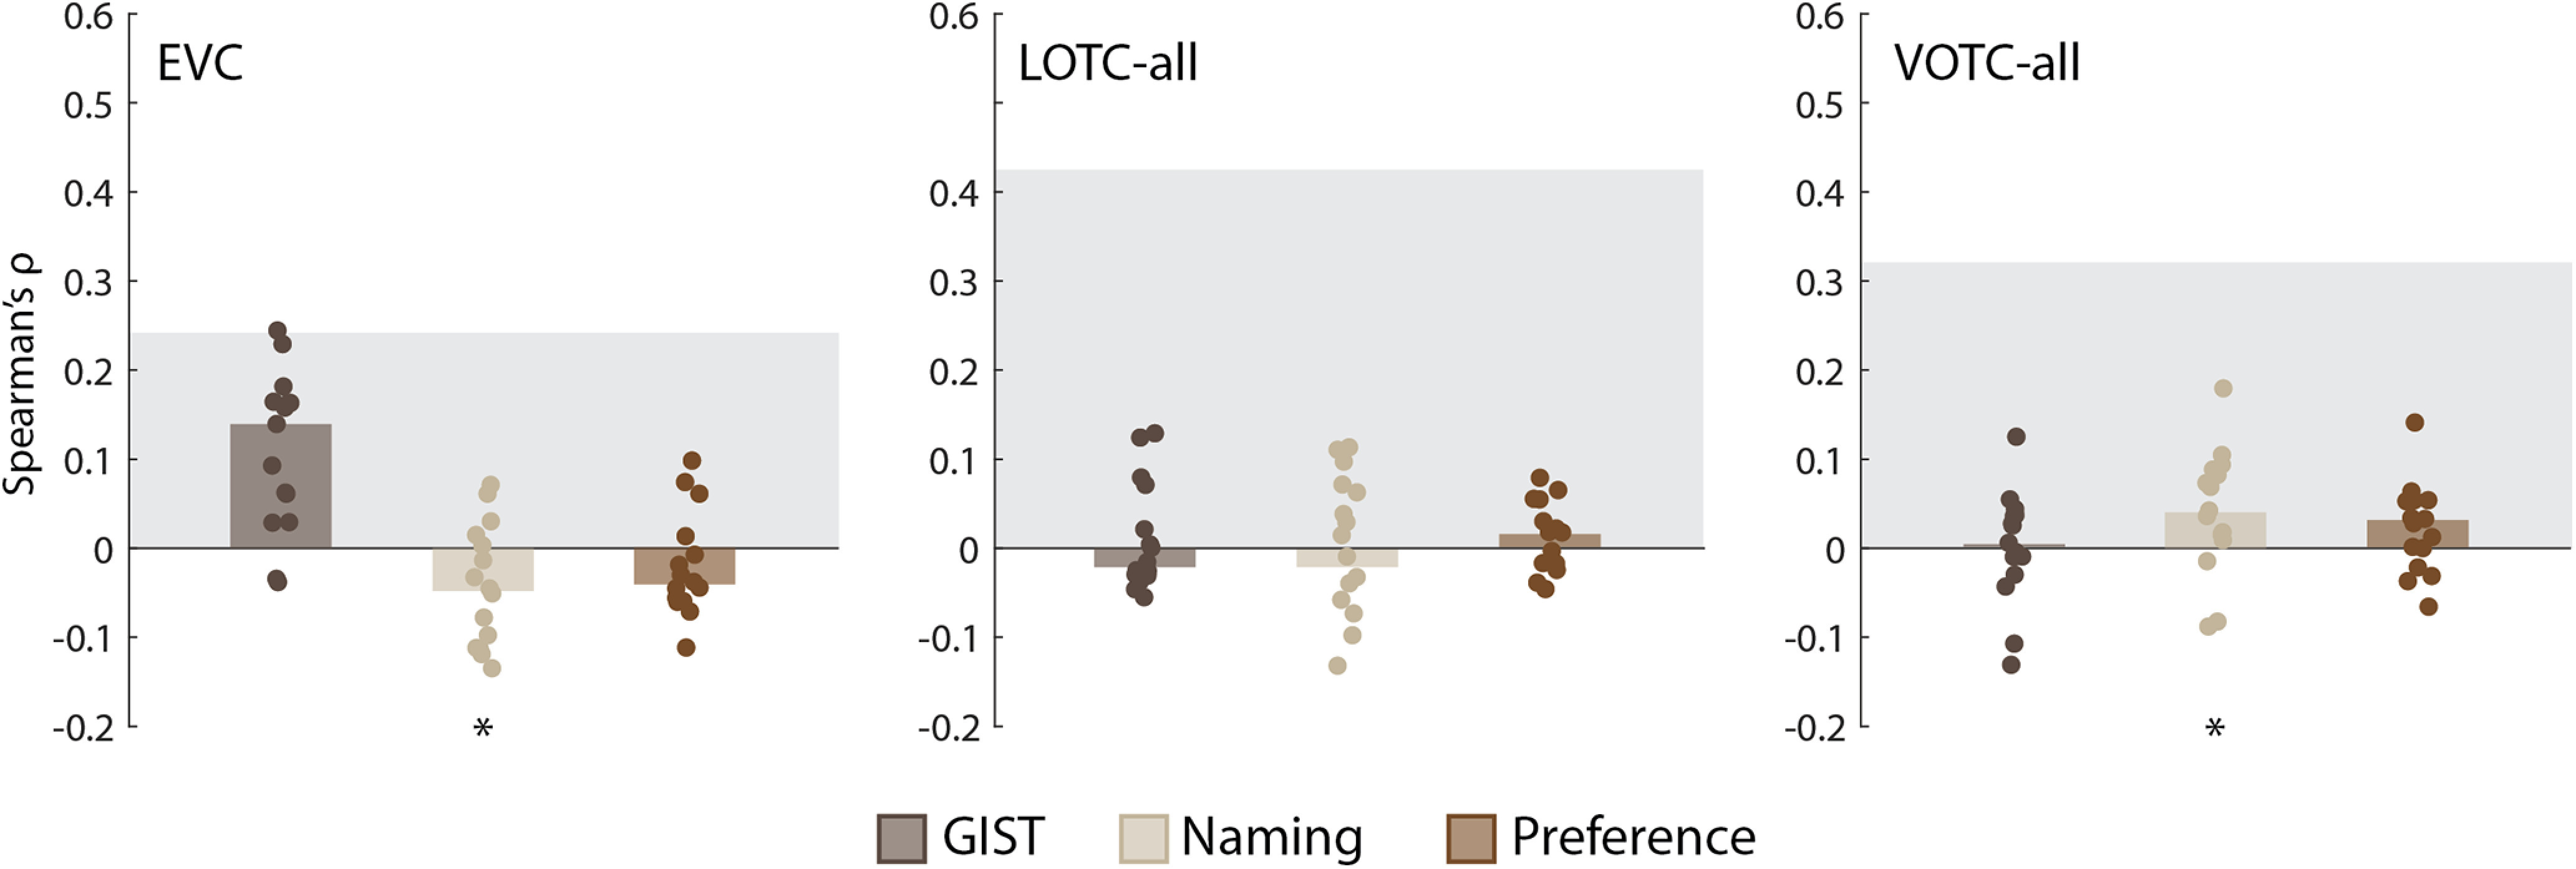
Figure 4.

Comparing the nuisance model RDMs to the EVC, LOTC-all, and VOTC-all. Bar charts indicating the median Spearman's ρ rank-order correlations between neural RDMs for individual subjects (dots) and the model RDMs. Gray blocks indicate the noise ceiling. *p < 0.05 based on Wilcoxon signed-rank tests.
