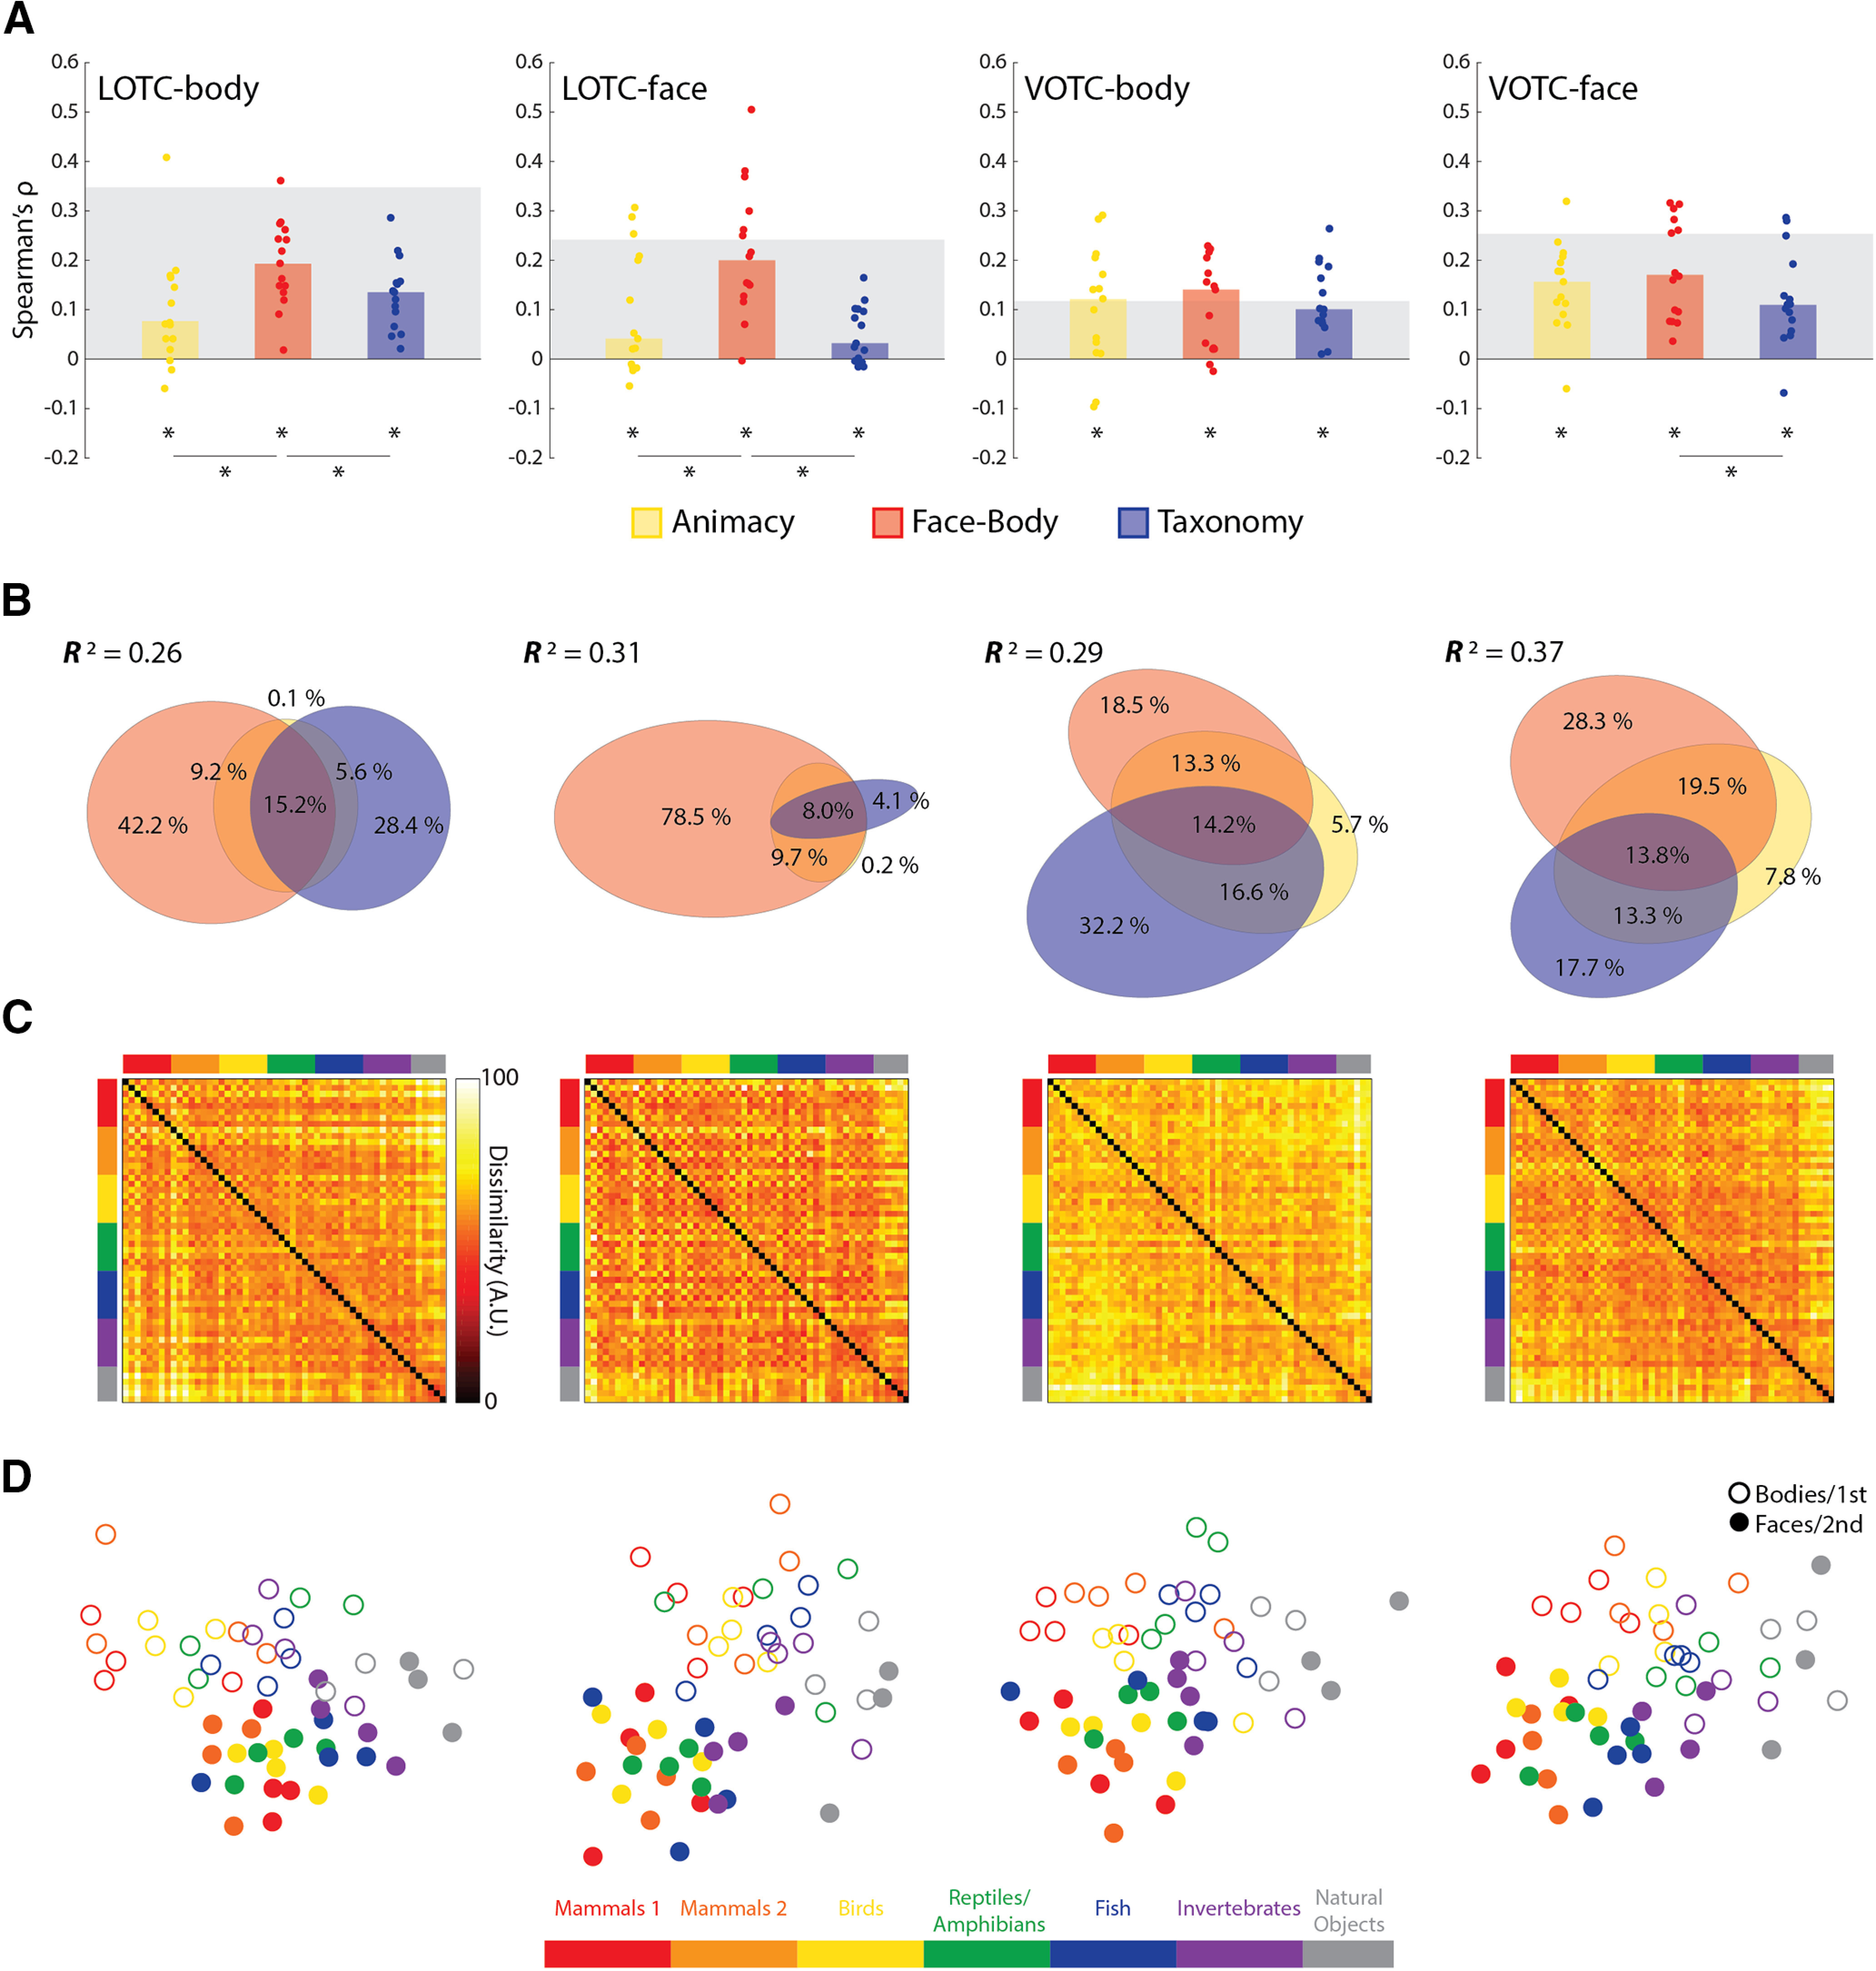
Figure 5.

Results of model RDM comparisons to face- and body-selective regions of OTC. A, Bar charts indicating the median Spearman's ρ rank-order correlations between neural RDMs for individual subjects and the three main model RDMs, for all four ROIs. B, Results of commonality analysis for all ROIs, visualized with Euler diagrams. C, Group-averaged neural RDMs for the four ROIs. D, Two-dimensional multidimensional scaling applied to the dissimilarity matrices for each ROI. Conventions follow those of Figure 2.
