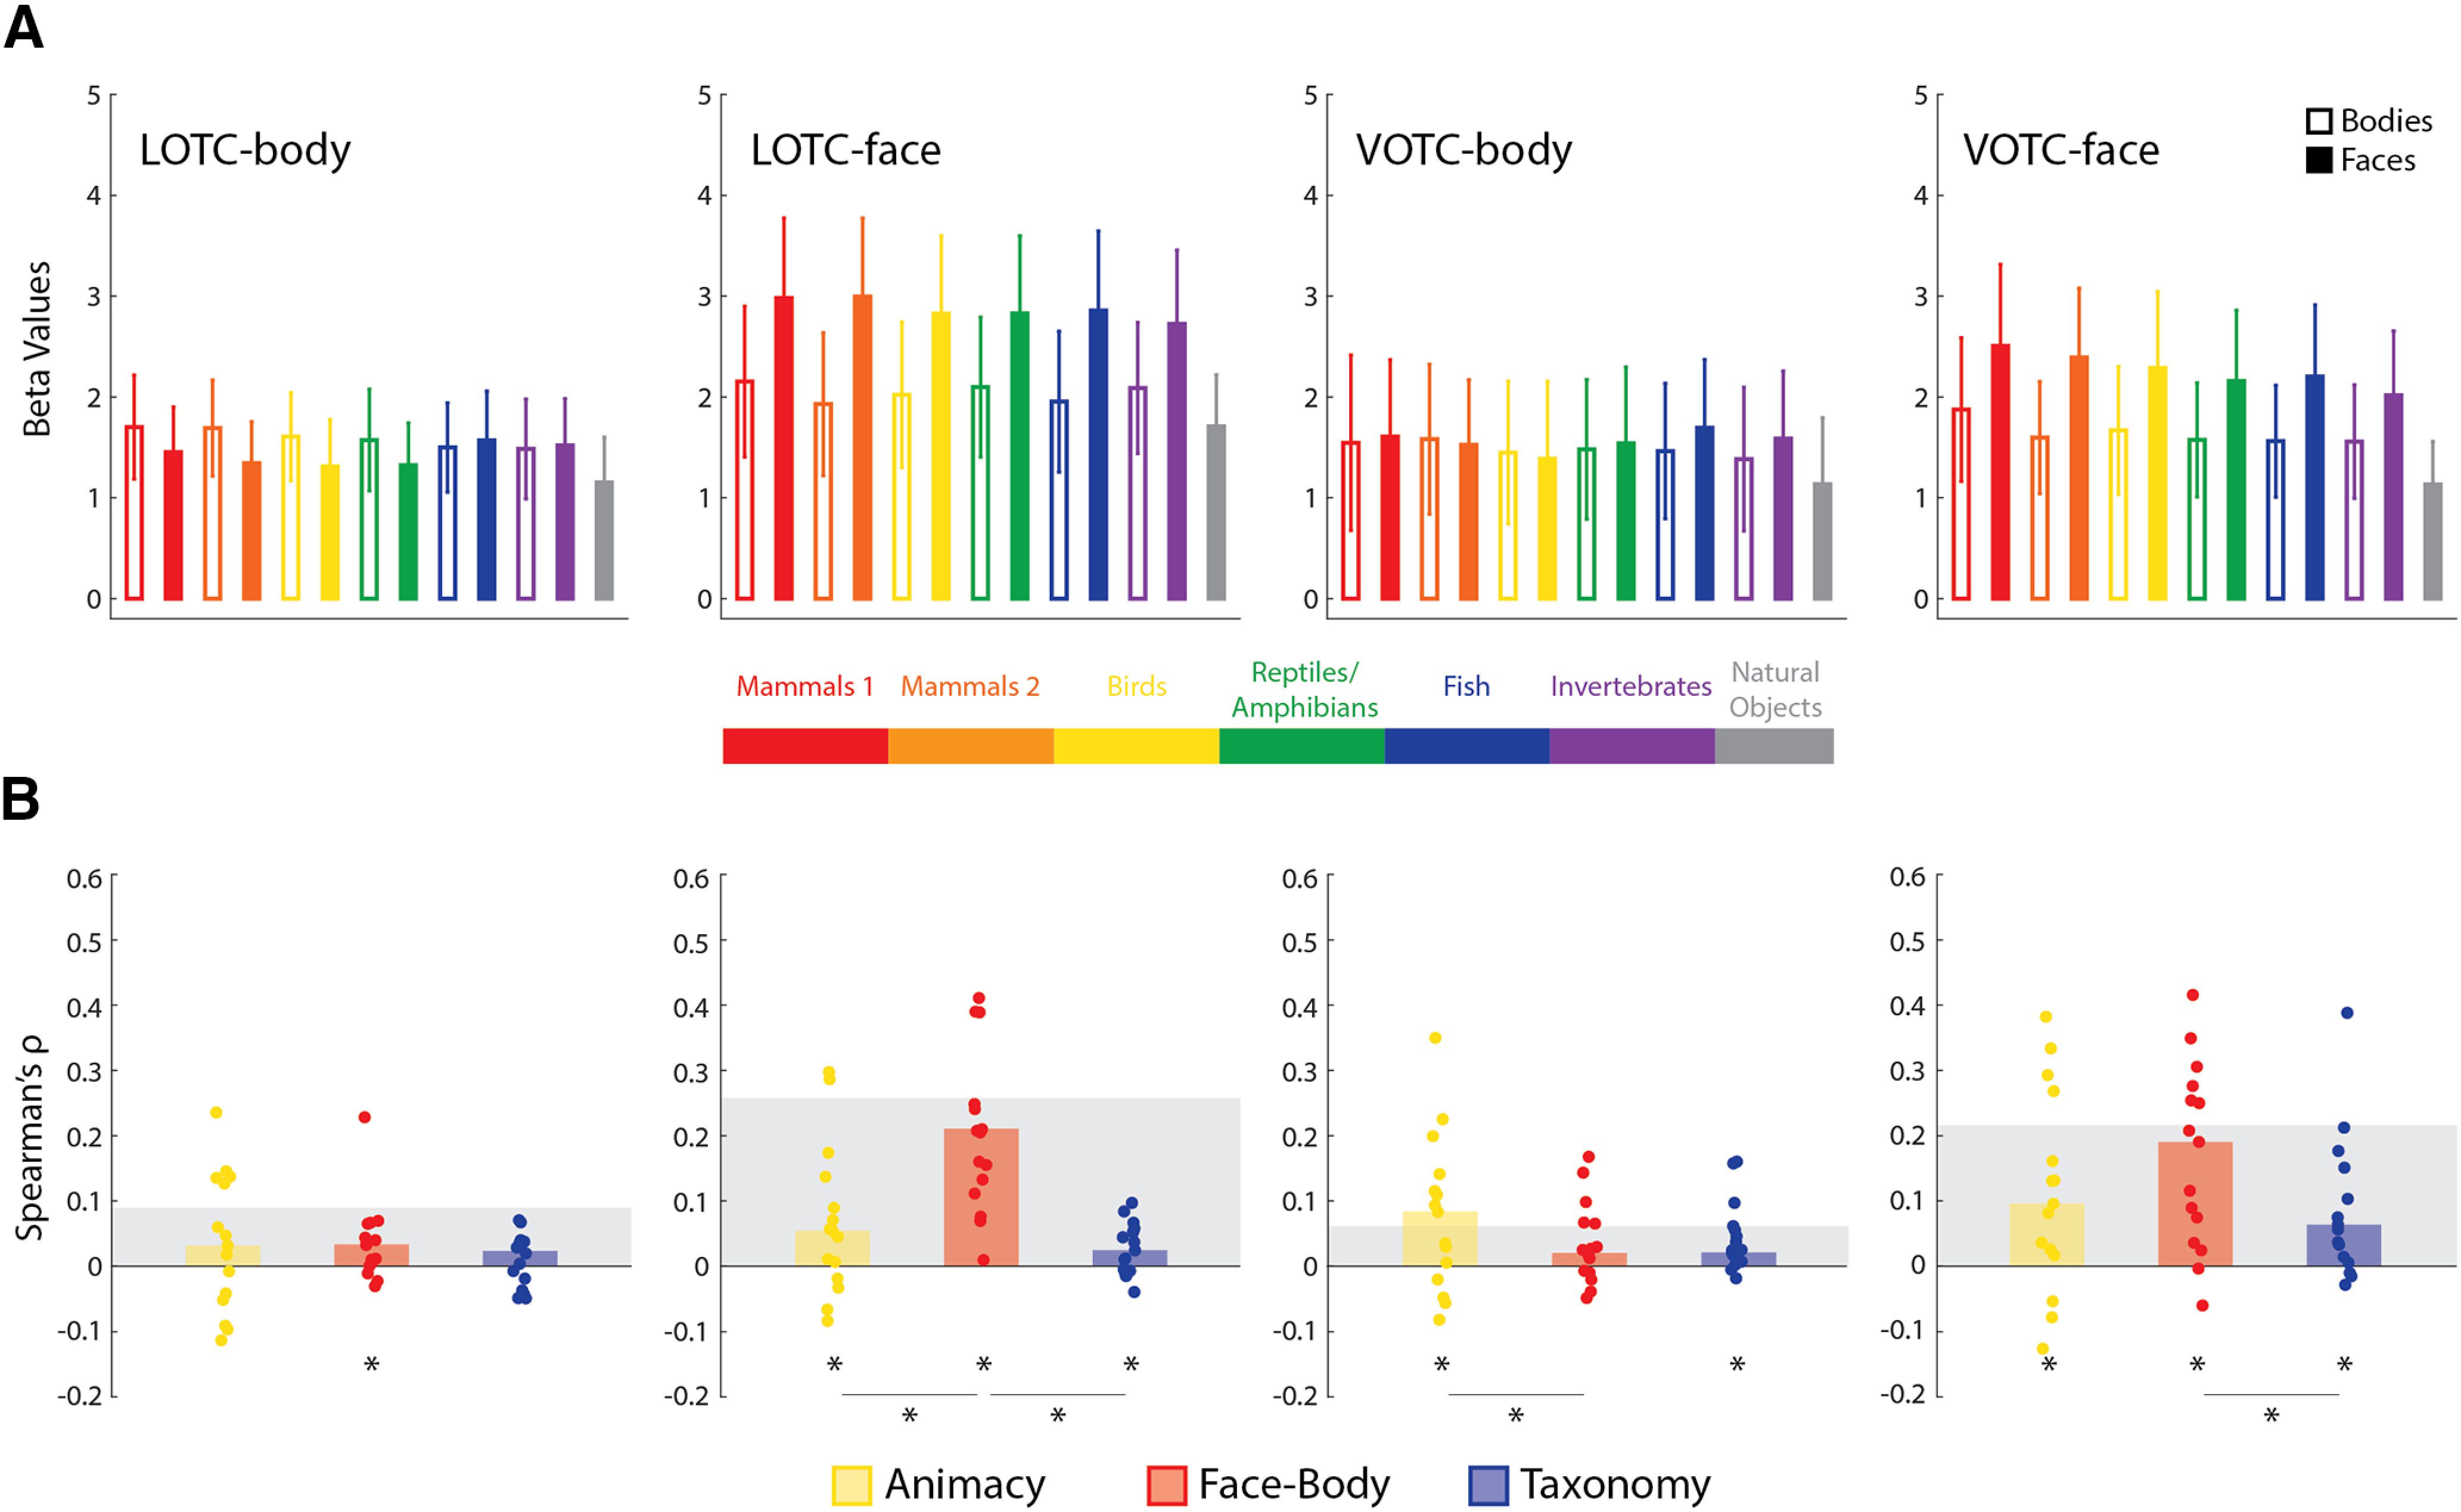
Figure 7.

Results of univariate RSA for the face- and body-selective ROIs. A, The average univariate responses for face and body images, at each level of the taxonomic hierarchy, are depicted against the average data of natural object images. Error bars indicate SEM. B, Bar charts indicating the median Spearman's ρ rank-order correlations between univariate RDMs for individual subjects (dots) and the three main model RDMs for all four ROIs. Gray blocks indicate the noise ceiling. *p < 0.05 based on Wilcoxon signed-rank tests.
