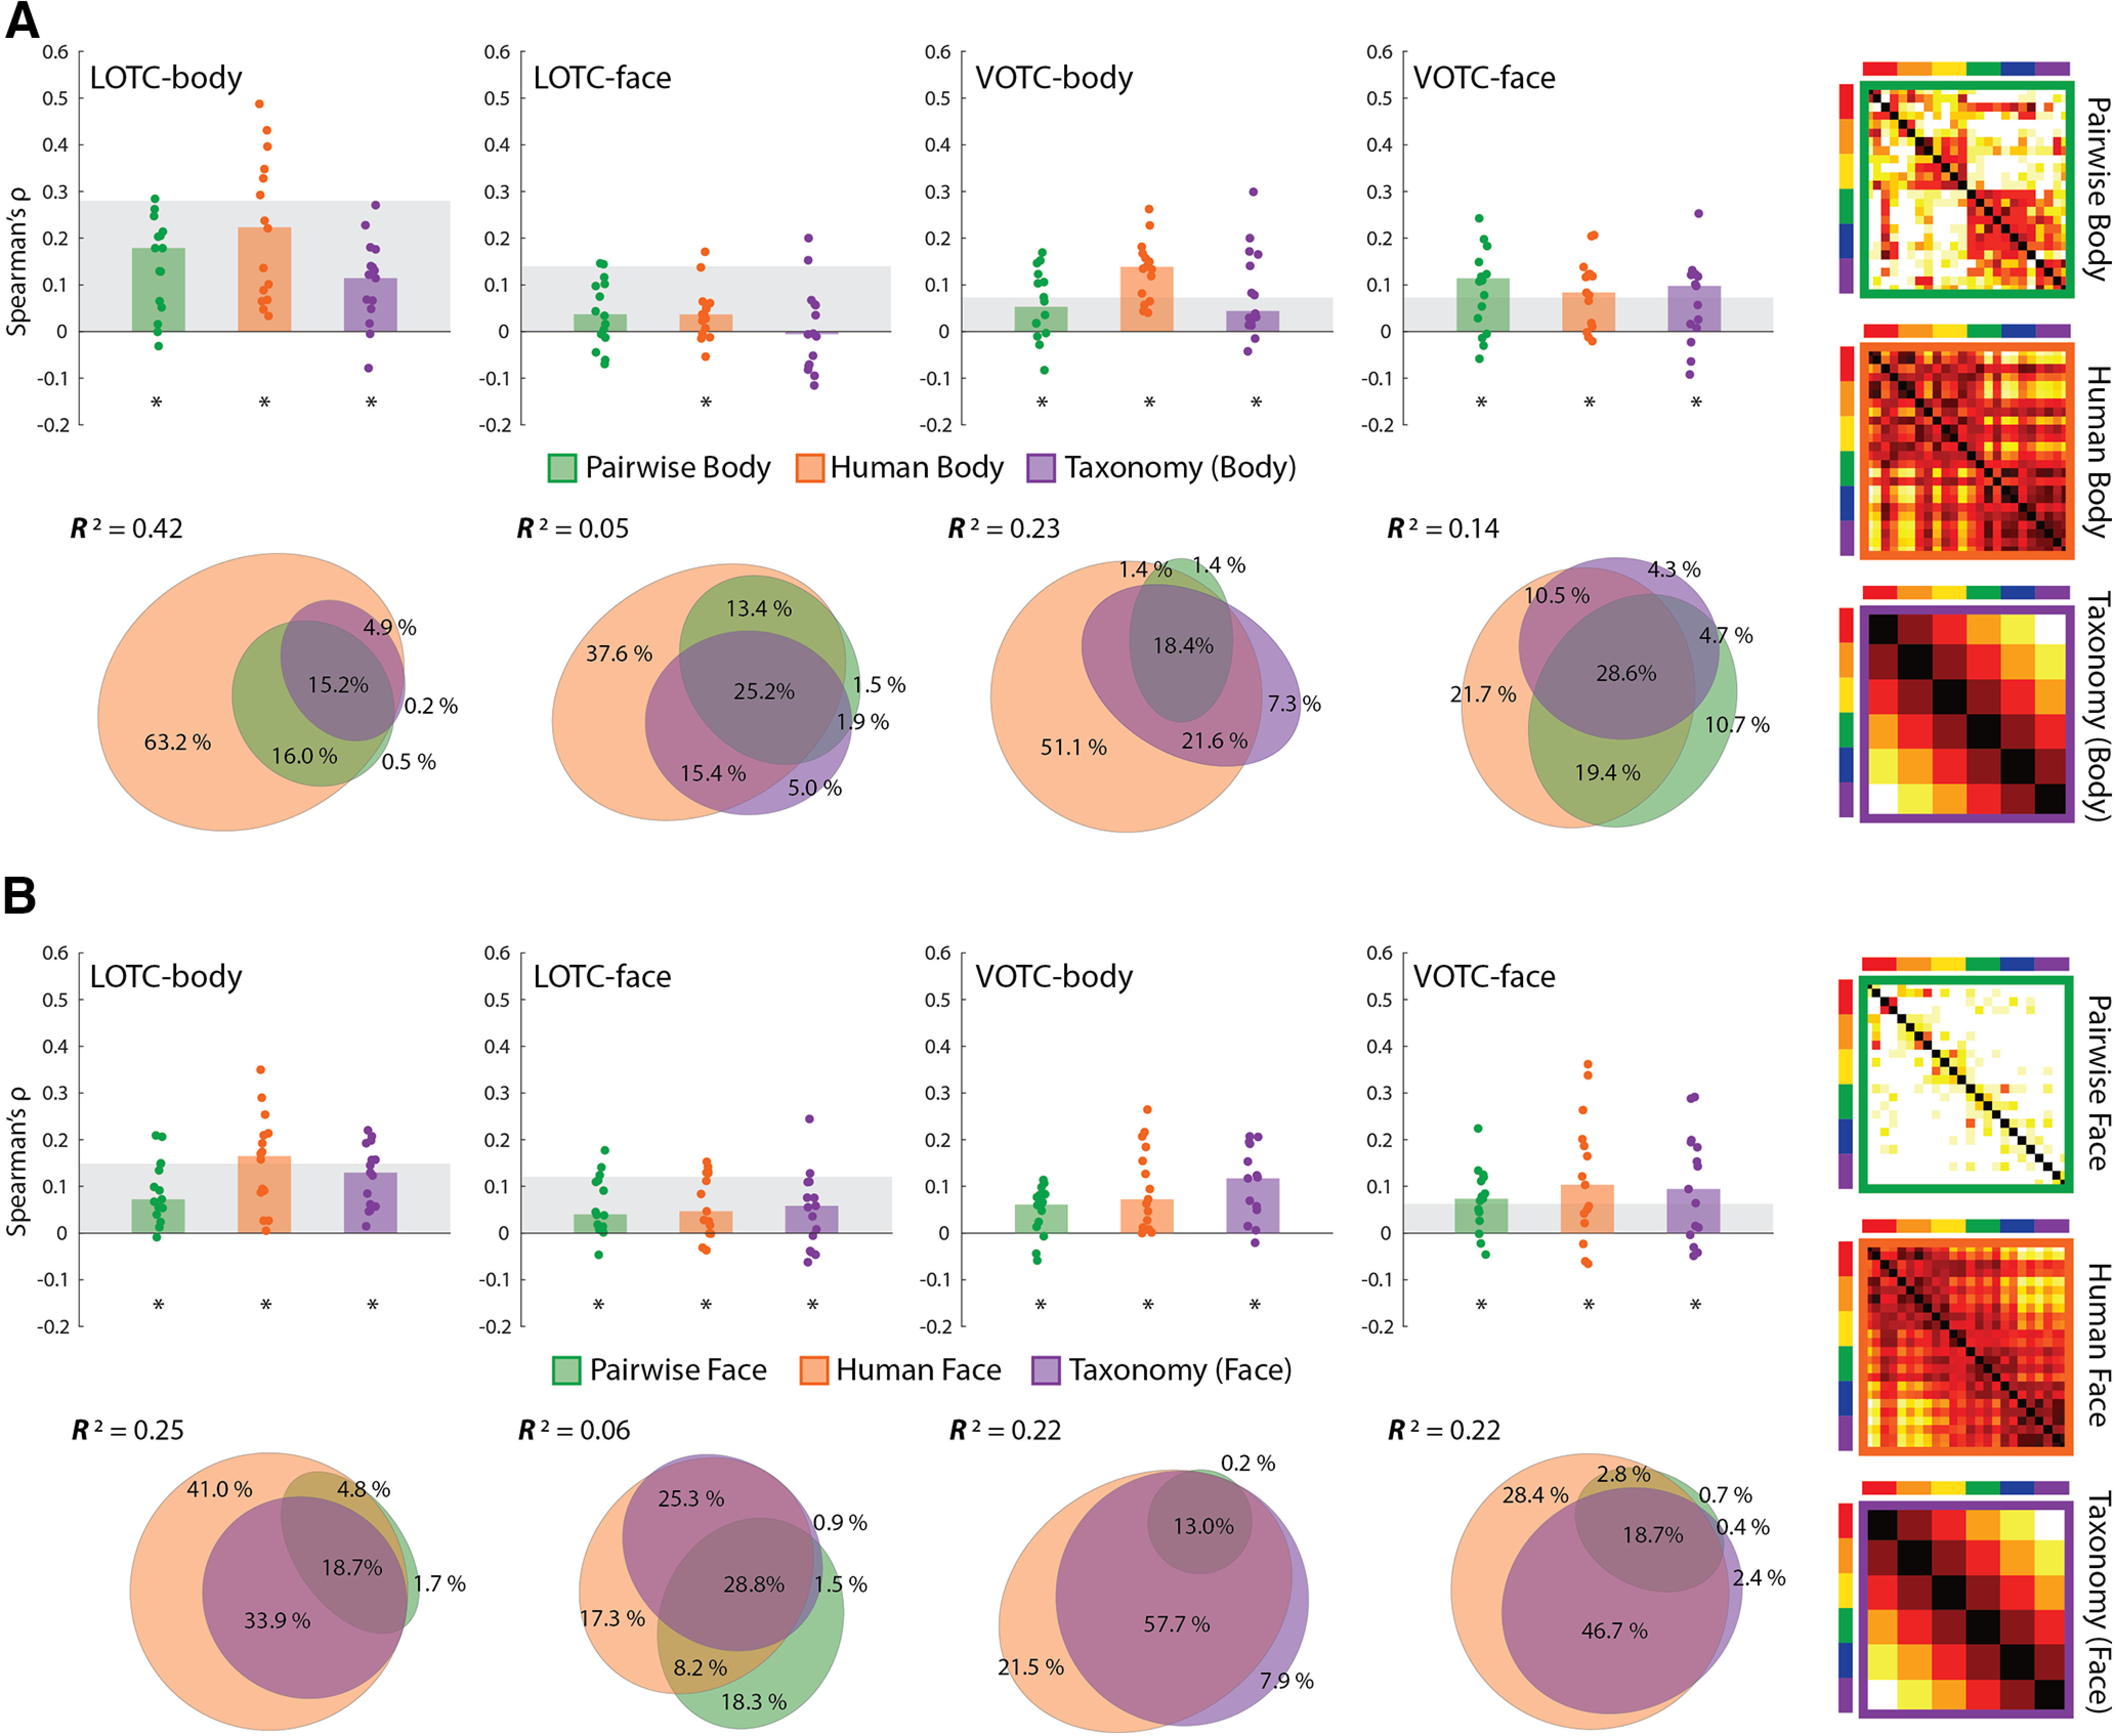
Figure 8.

Results of comparing model RDMs for face and body stimuli to face- and body-selective regions of the OTC. A, Bar charts indicating the median Spearman's ρ rank-order correlations between neural RDMs for individual subjects and three model RDMs for the body images (also depicted); pairwise body similarity judgments (Pairwise Body), human similarity judgments (Human Body), and a (6-level) taxonomy model for 24 images. B, Bar charts and commonality analysis for the three model RDMs for the face images (also depicted). All conventions are the same as in Figure 2.
