
Figure 9.
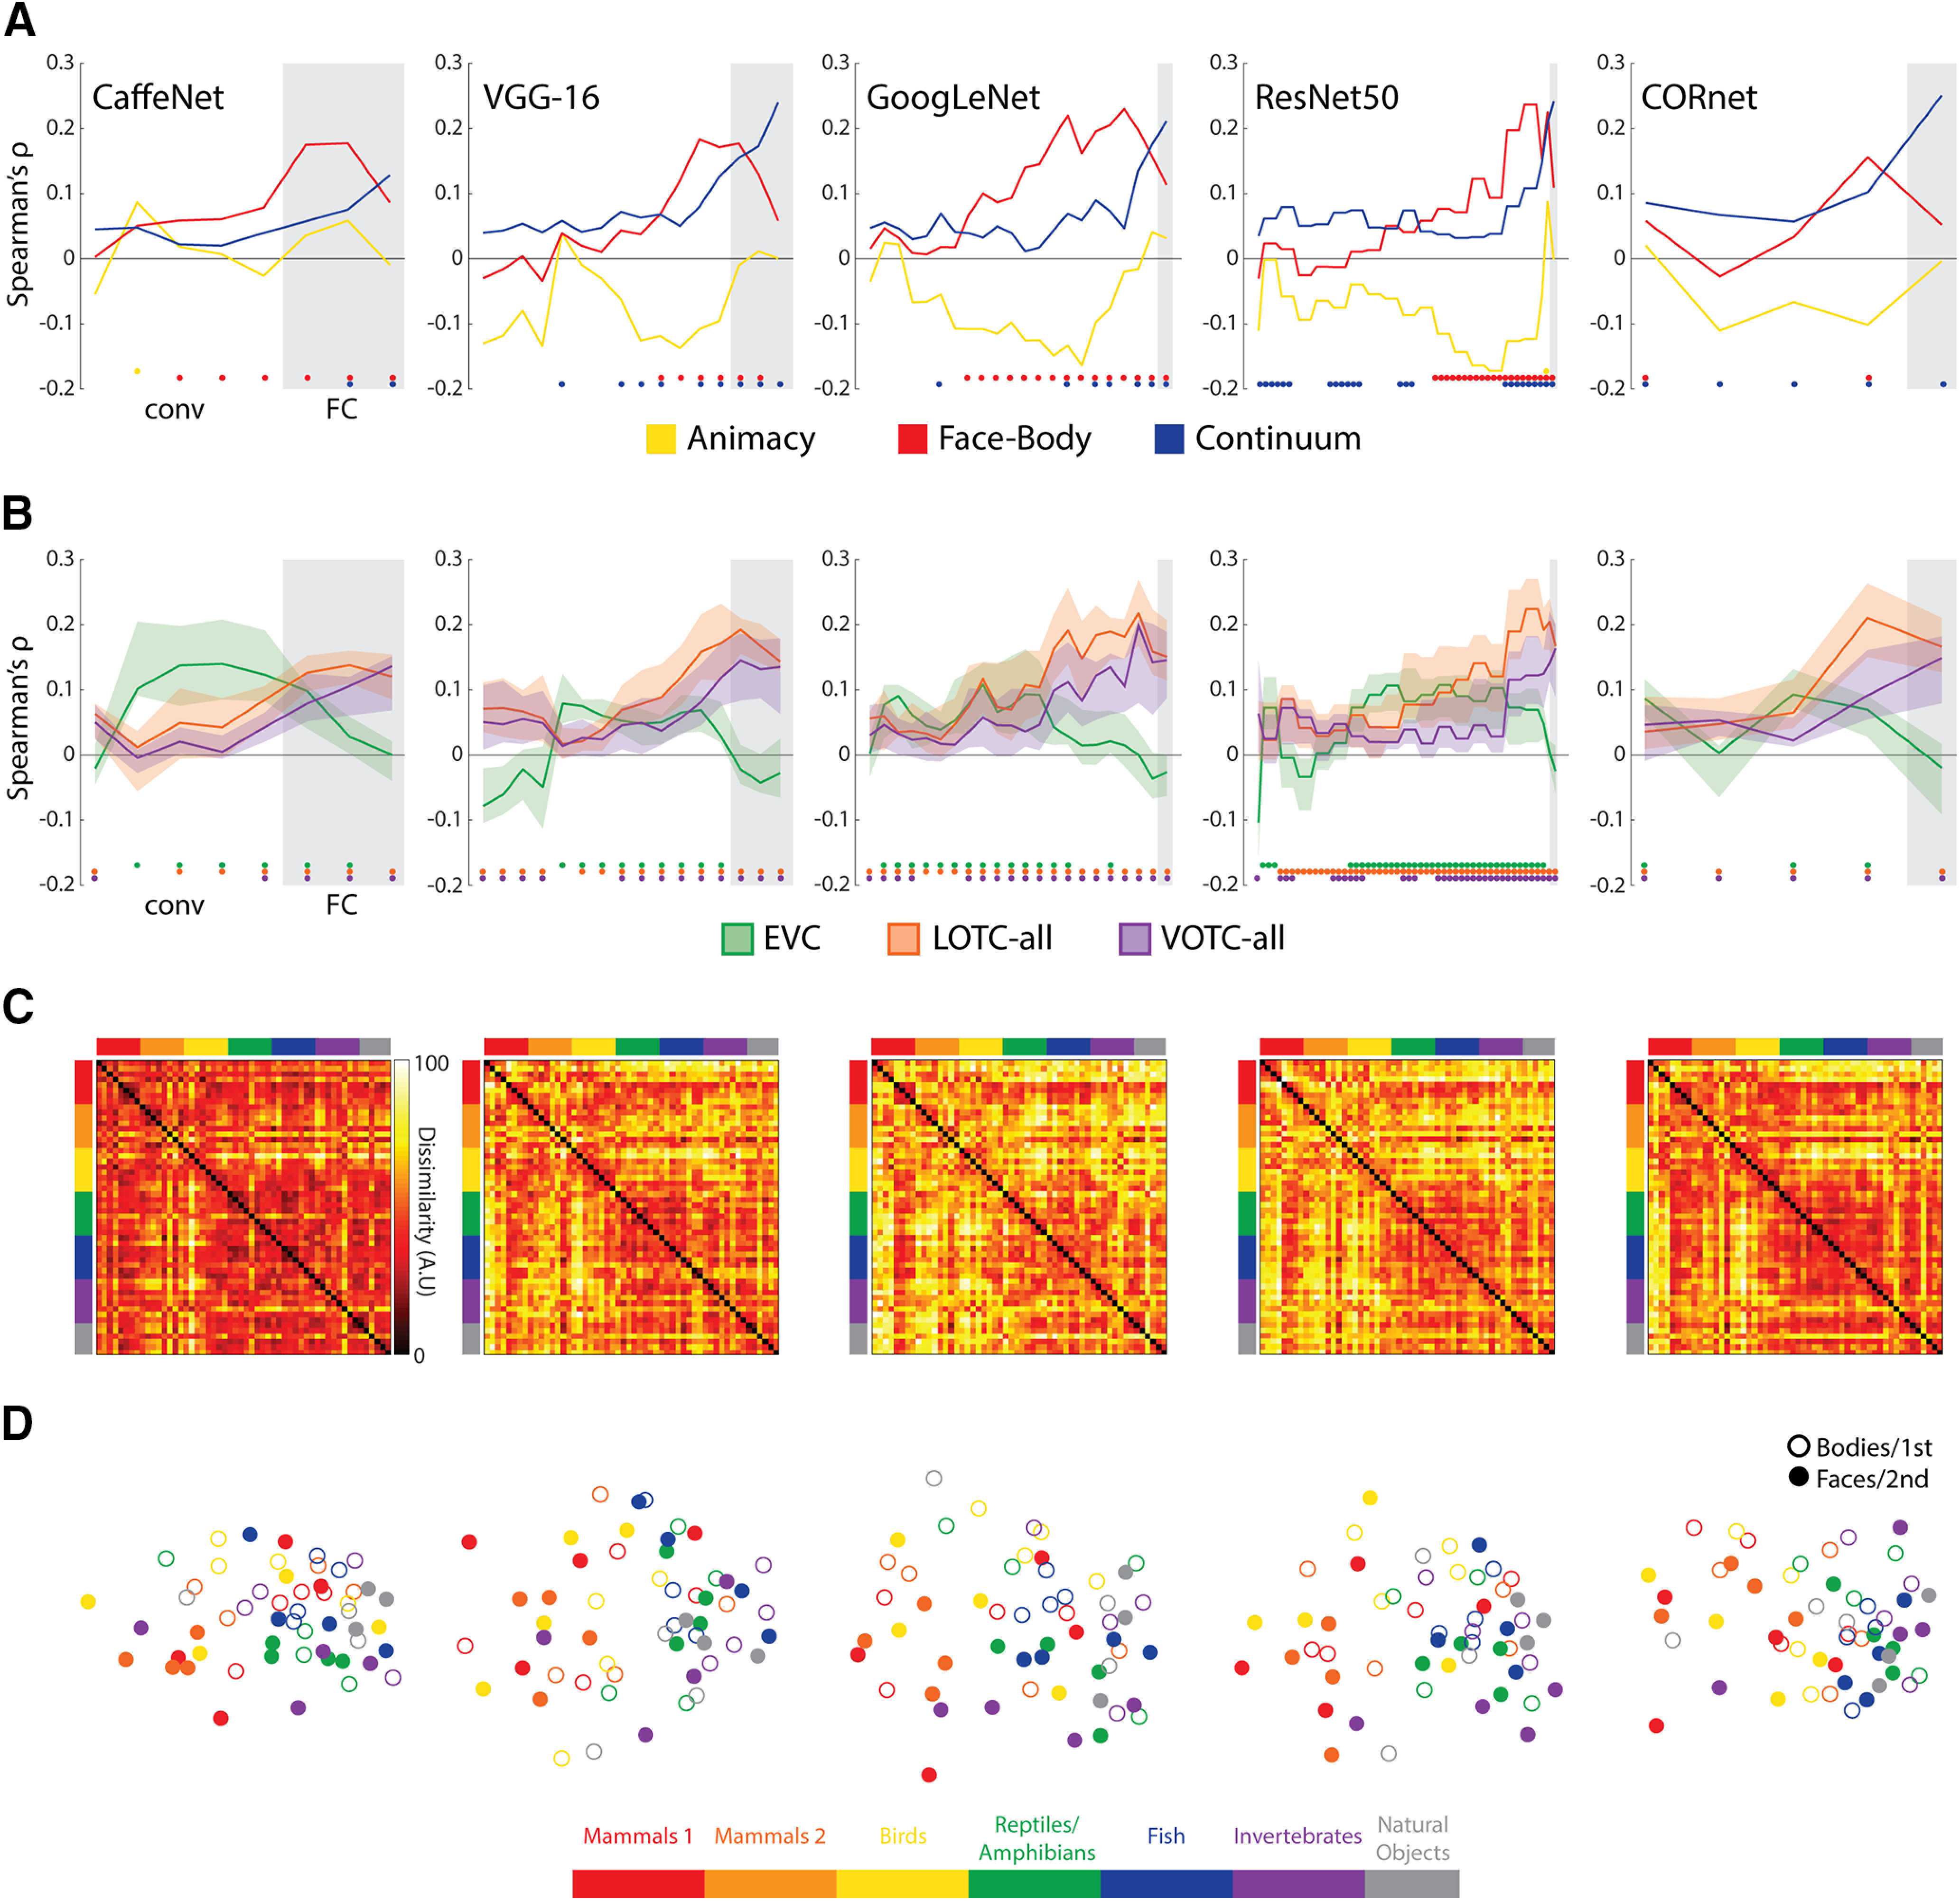
Results of RSA with DNNs for all 54 images. A, The layers of each of the five networks correlated with each of the three model RDMs. B, The layers of each of the five networks correlated with the individual subject neural RDMs for the three initial ROIs considered. The solid lines indicate the median correlations at each layer, and the transparent regions range from the first quartile to the third quartile. For both A and B, gray areas indicate FC/decoding layers for each network and are preceded by the conv/area layers. Color-coded dots indicate significant (positive) correlations at p < .05 (FDR adjusted), based on two-sided permutation tests. C, RDMs for the final layers of each of the DNNs. D, Two-dimensional multidimensional scaling applied to the dissimilarity matrices for each DNN. Conventions follow those of Figure 2.