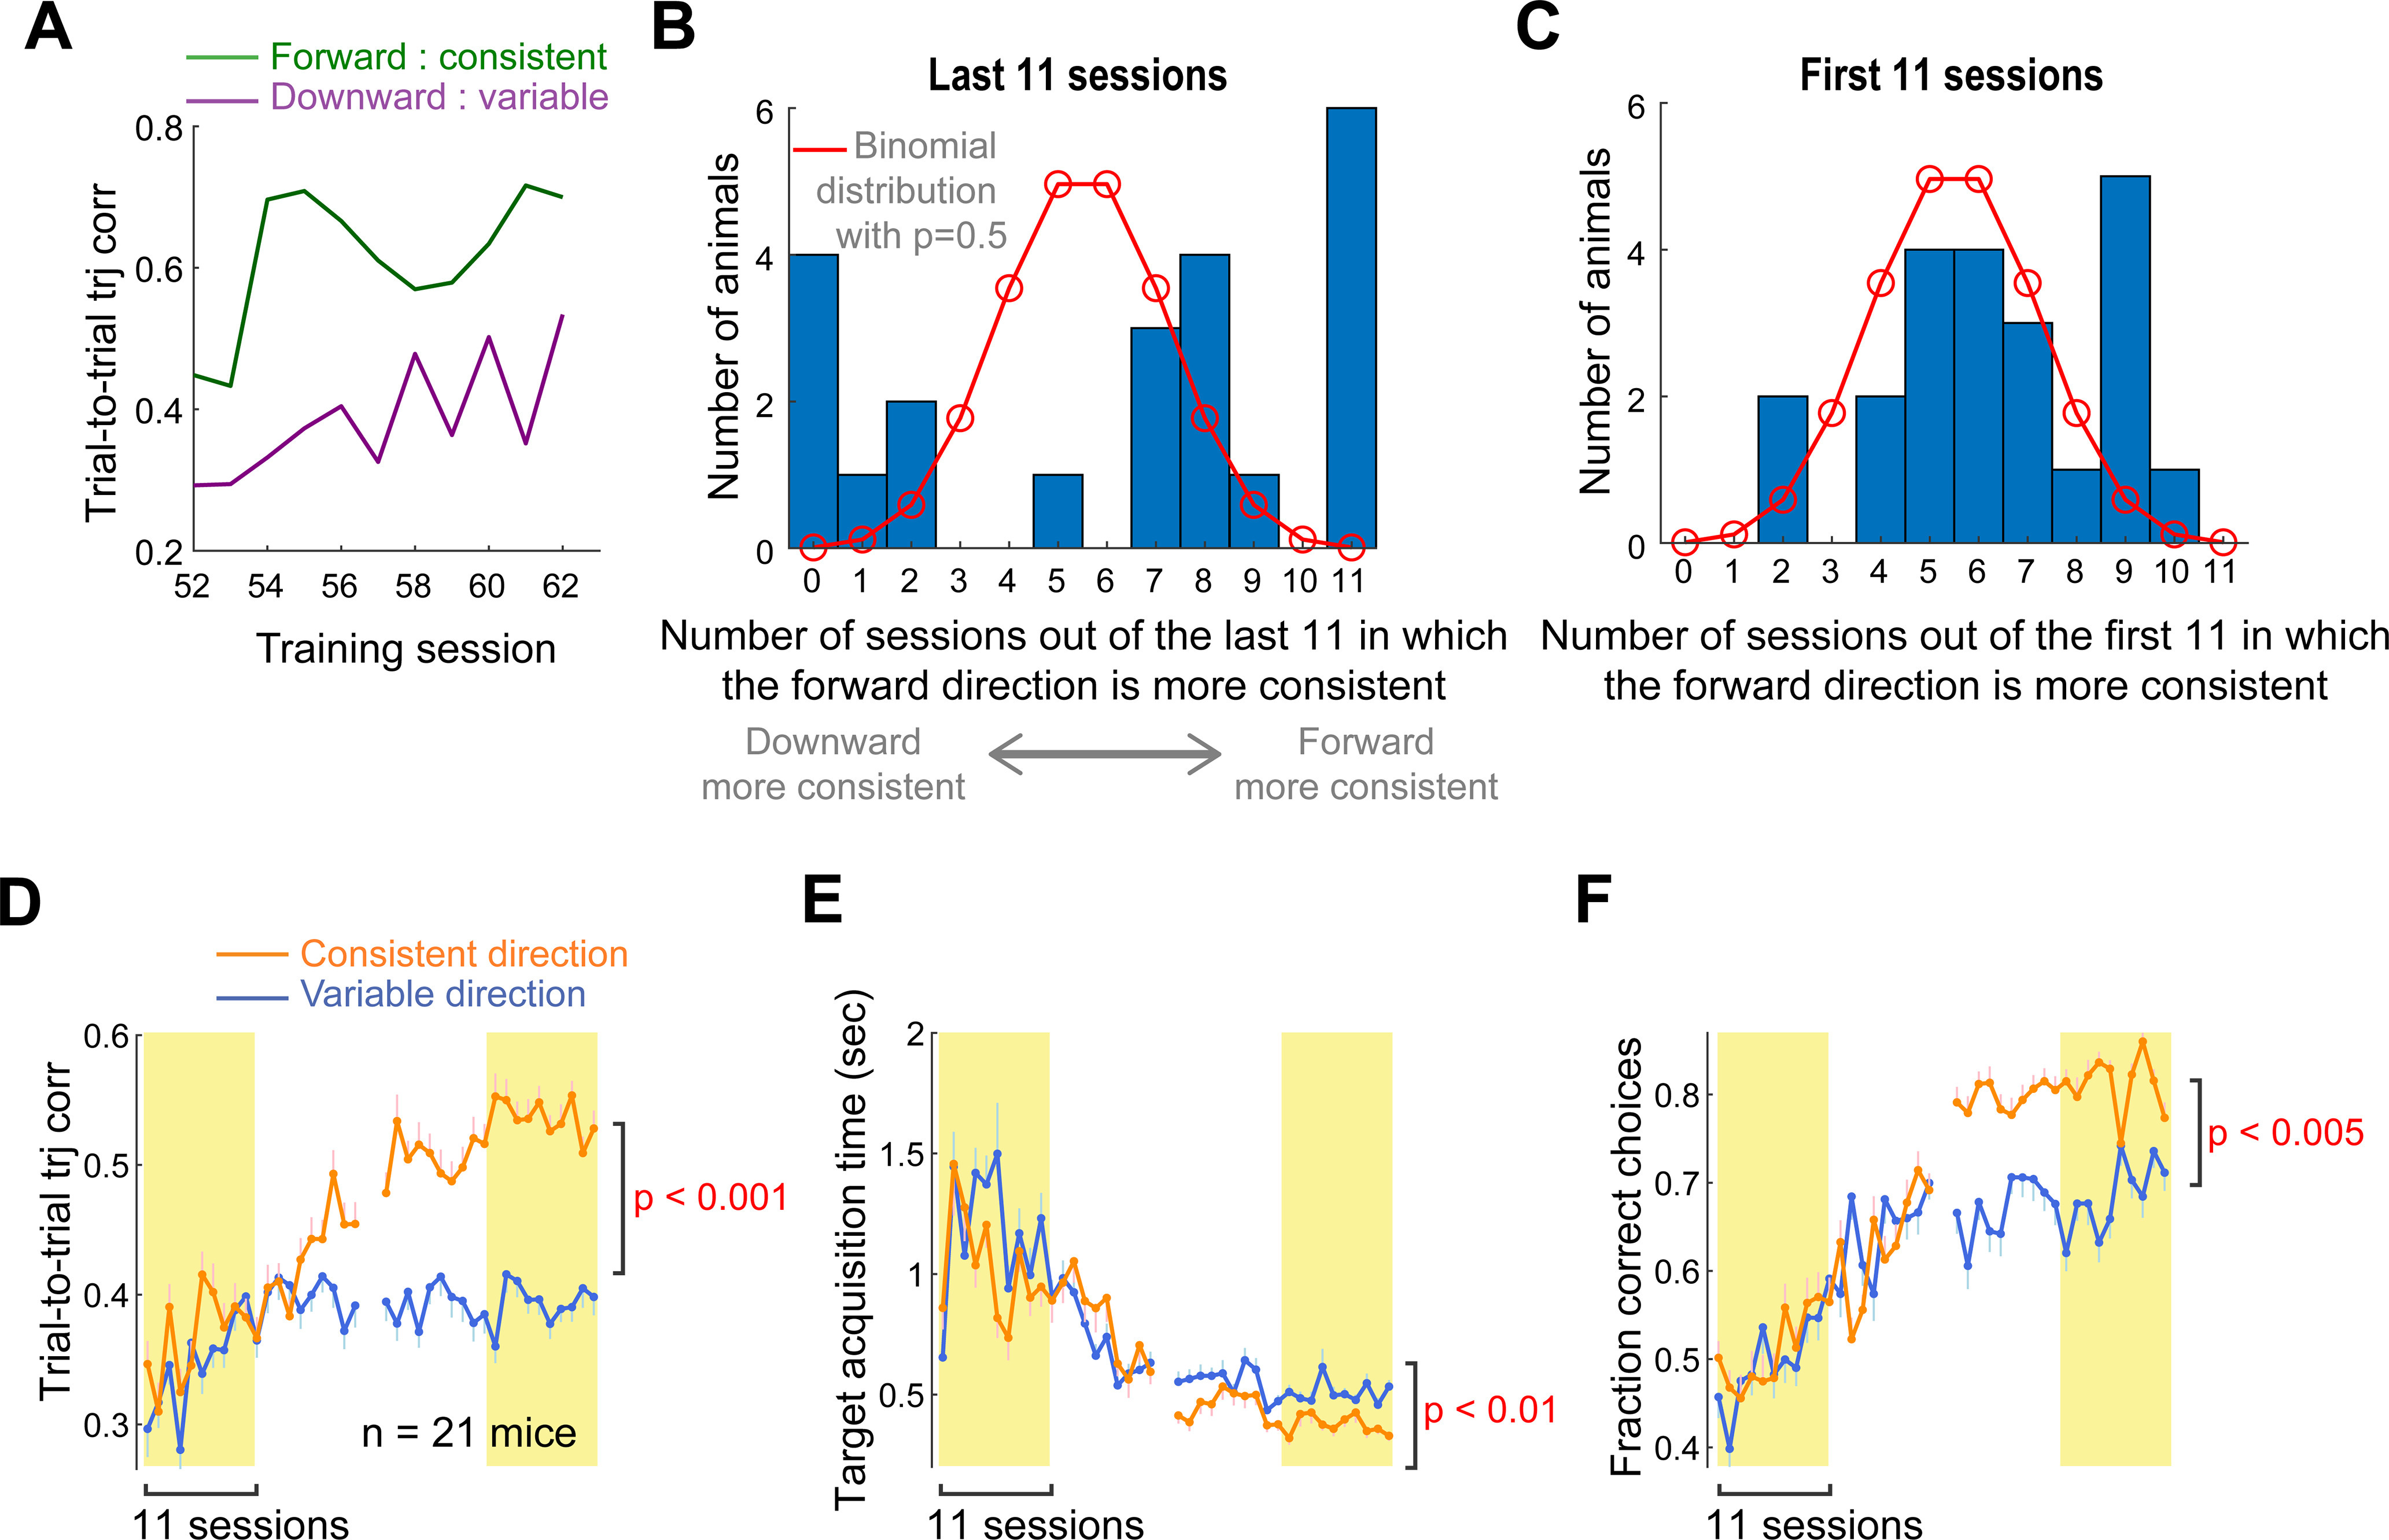
Figure 2.

Asymmetric motor performance between the two reach directions. A, The trial-to-trial trajectory correlation in the last 11 training sessions of the example mouse shown in Figure 1E, separately for each direction. The forward movements are more consistent across trials than the downward movements, reliably across sessions in this mouse. B, The distribution of the number of sessions of the last 11 in which the trial-to-trial trajectory correlation is higher for movement in the forward than downward direction, across 22 mice. Red line indicates the expected, null distribution when the direction with a higher correlation is randomly chosen with a chance of 0.5 (i.e., binomial distribution). C, The distribution of the number of sessions of the first 11 in which trial-to-trial trajectory correlation is higher for movement in the forward than downward direction across 22 mice. The same illustration format as in B. D, The trial-to-trial trajectory correlation as a function of training session, respectively, for consistent and variable directions. The consistent direction of each mouse was defined as the direction associated with a higher trajectory correlation during the last 11 training sessions. Animals that exhibited the same consistent direction in at least 7 sessions of the last 11 were included. Data are mean ± SE (n = 21 mice). The mean correlation coefficient in the last 11 sessions was compared between the consistent and variable direction across 21 mice (paired bootstrap test; Table 1). E, The fraction of correct choices, respectively, for the consistent and variable directions defined solely based on the trial-to-trial trajectory correlation. The same illustration format and statistical test as in D. F, The target acquisition time. The same illustration format and statistical test as in D.
