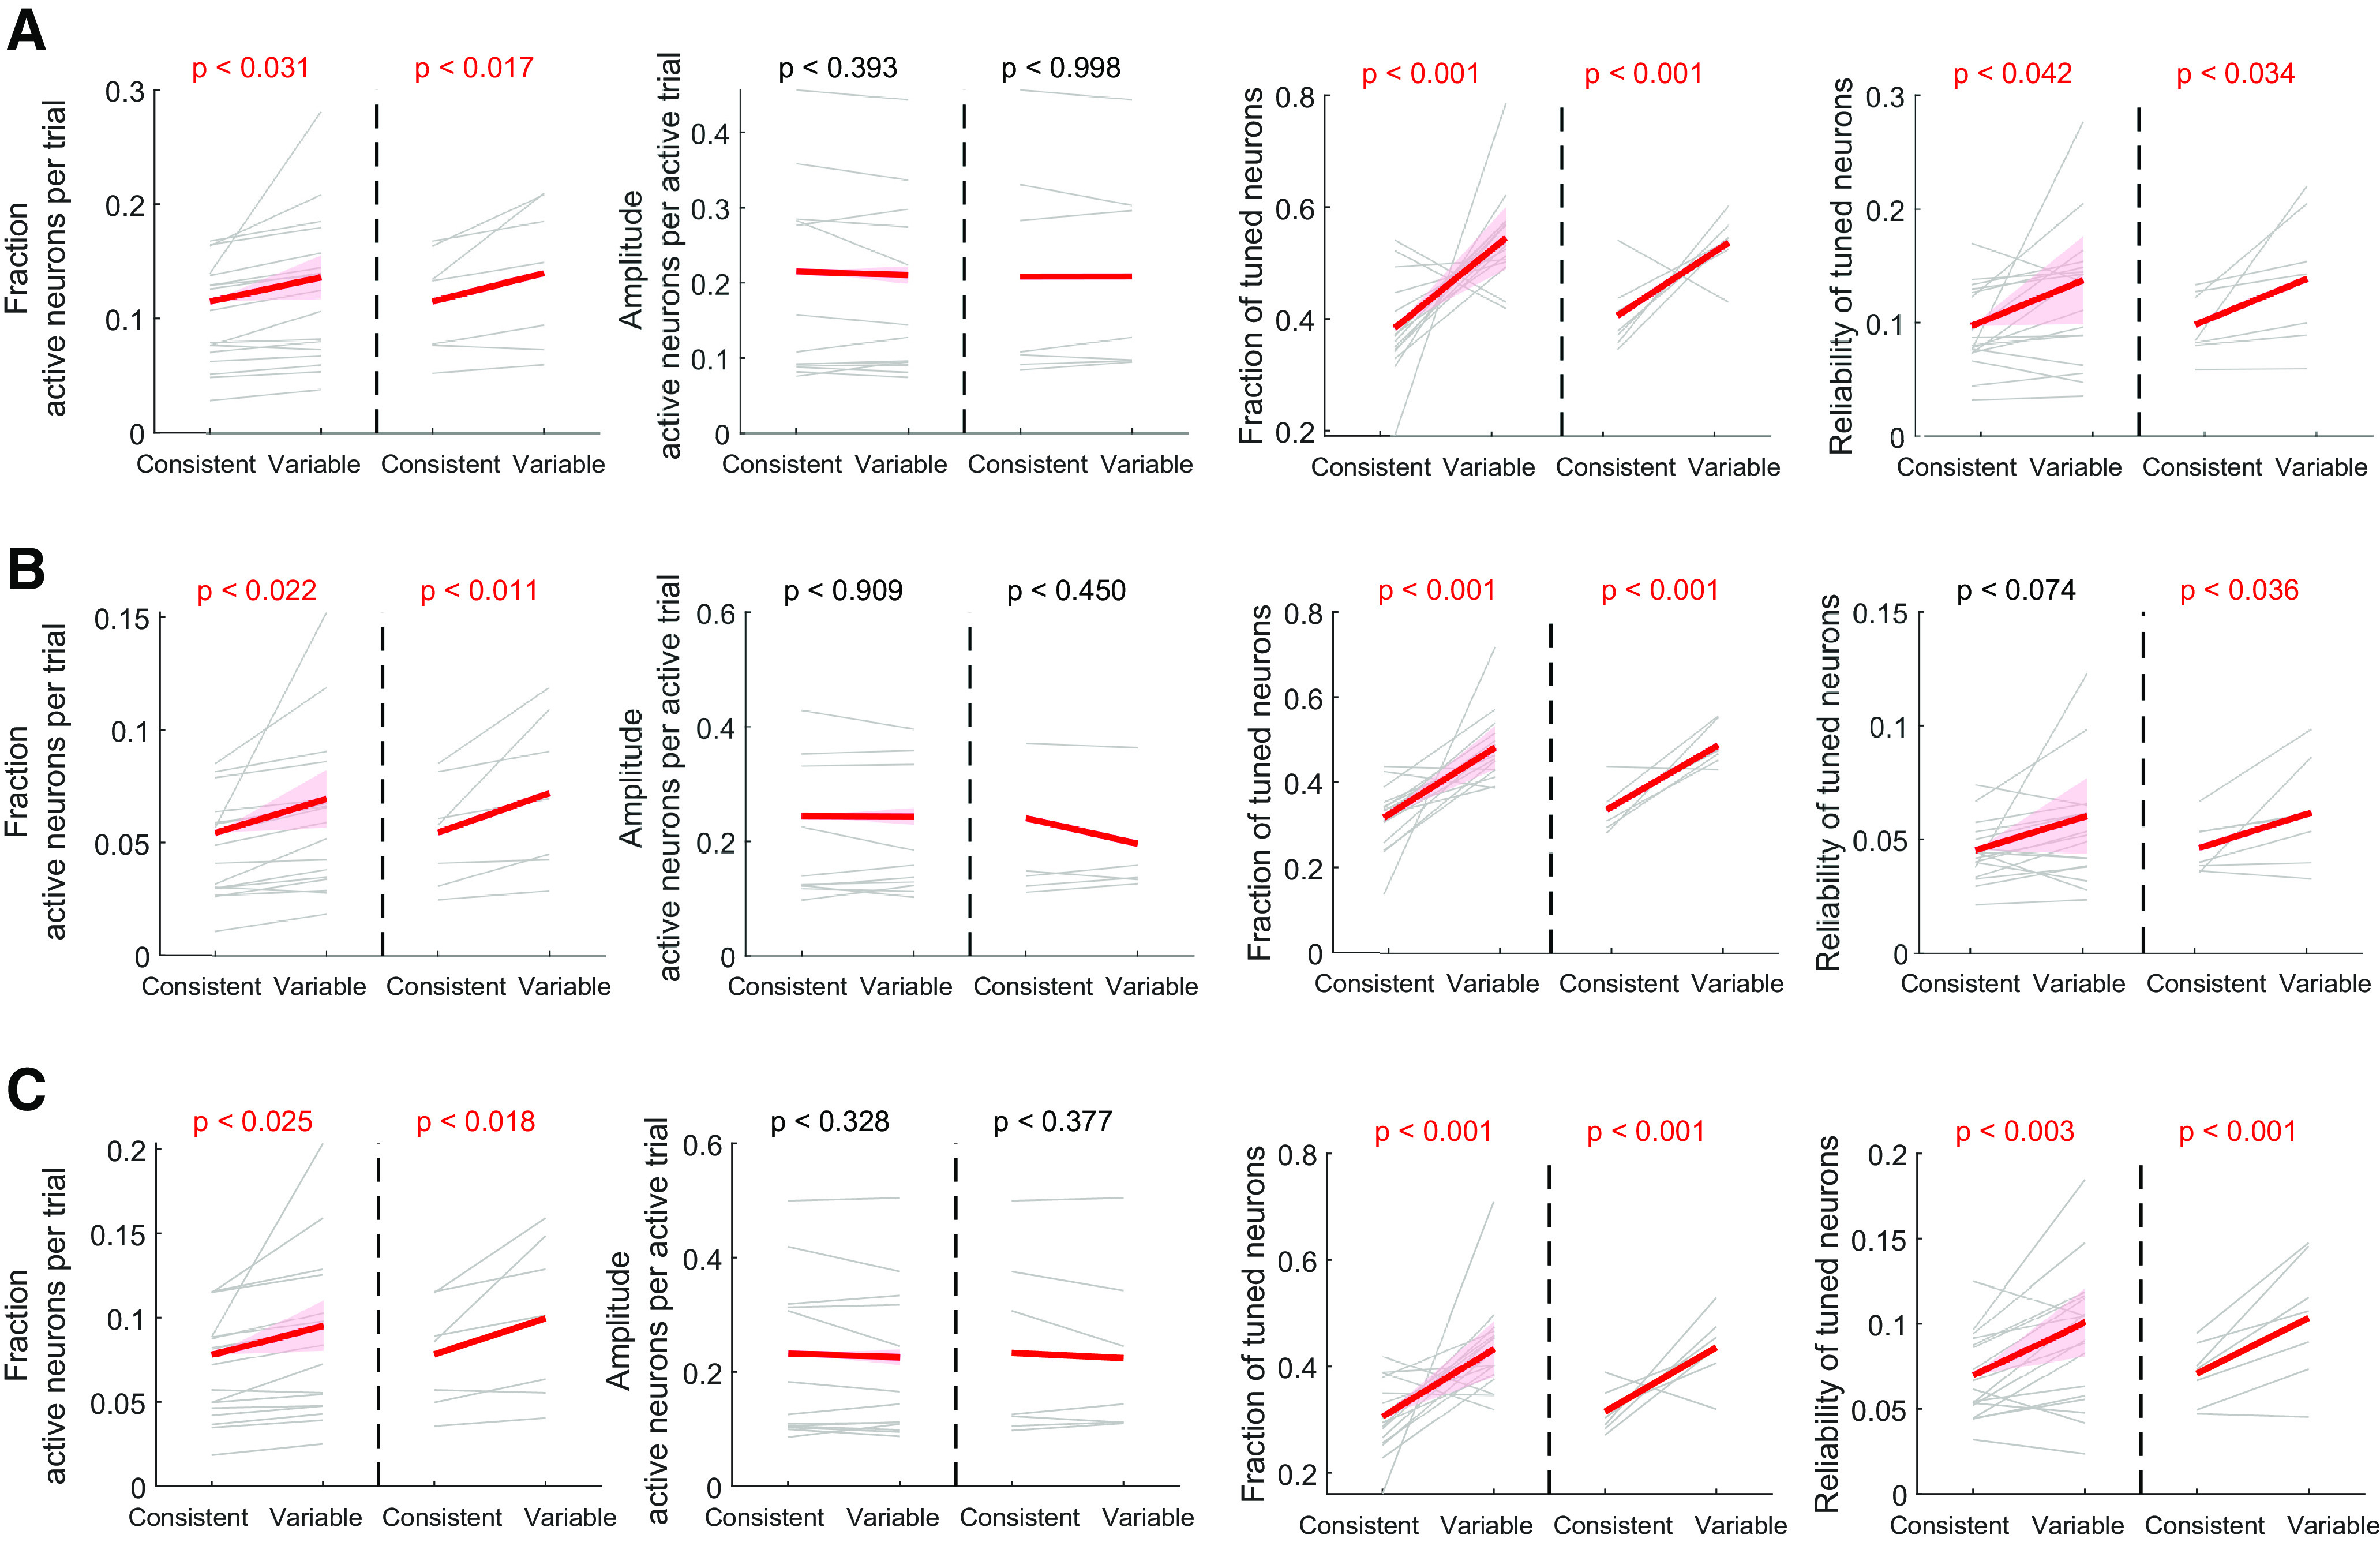
Figure 8.

M1 activity comparison between the consistent- and variable-direction movements. A, The same format and analyses as Figure 7F-I, but using mean + 1.5 SD of the baseline activity as the per-neuron activation threshold. B, The same as in A, but using mean + 2.5 SD of the baseline activity as the per-neuron activation threshold. Note the similar trends in the direction dependency across different thresholds. C, The same as in A, but only using neurons that showed reliability difference between the two directions of at least 0.01. The trends are similar to the analyses using all neurons.
