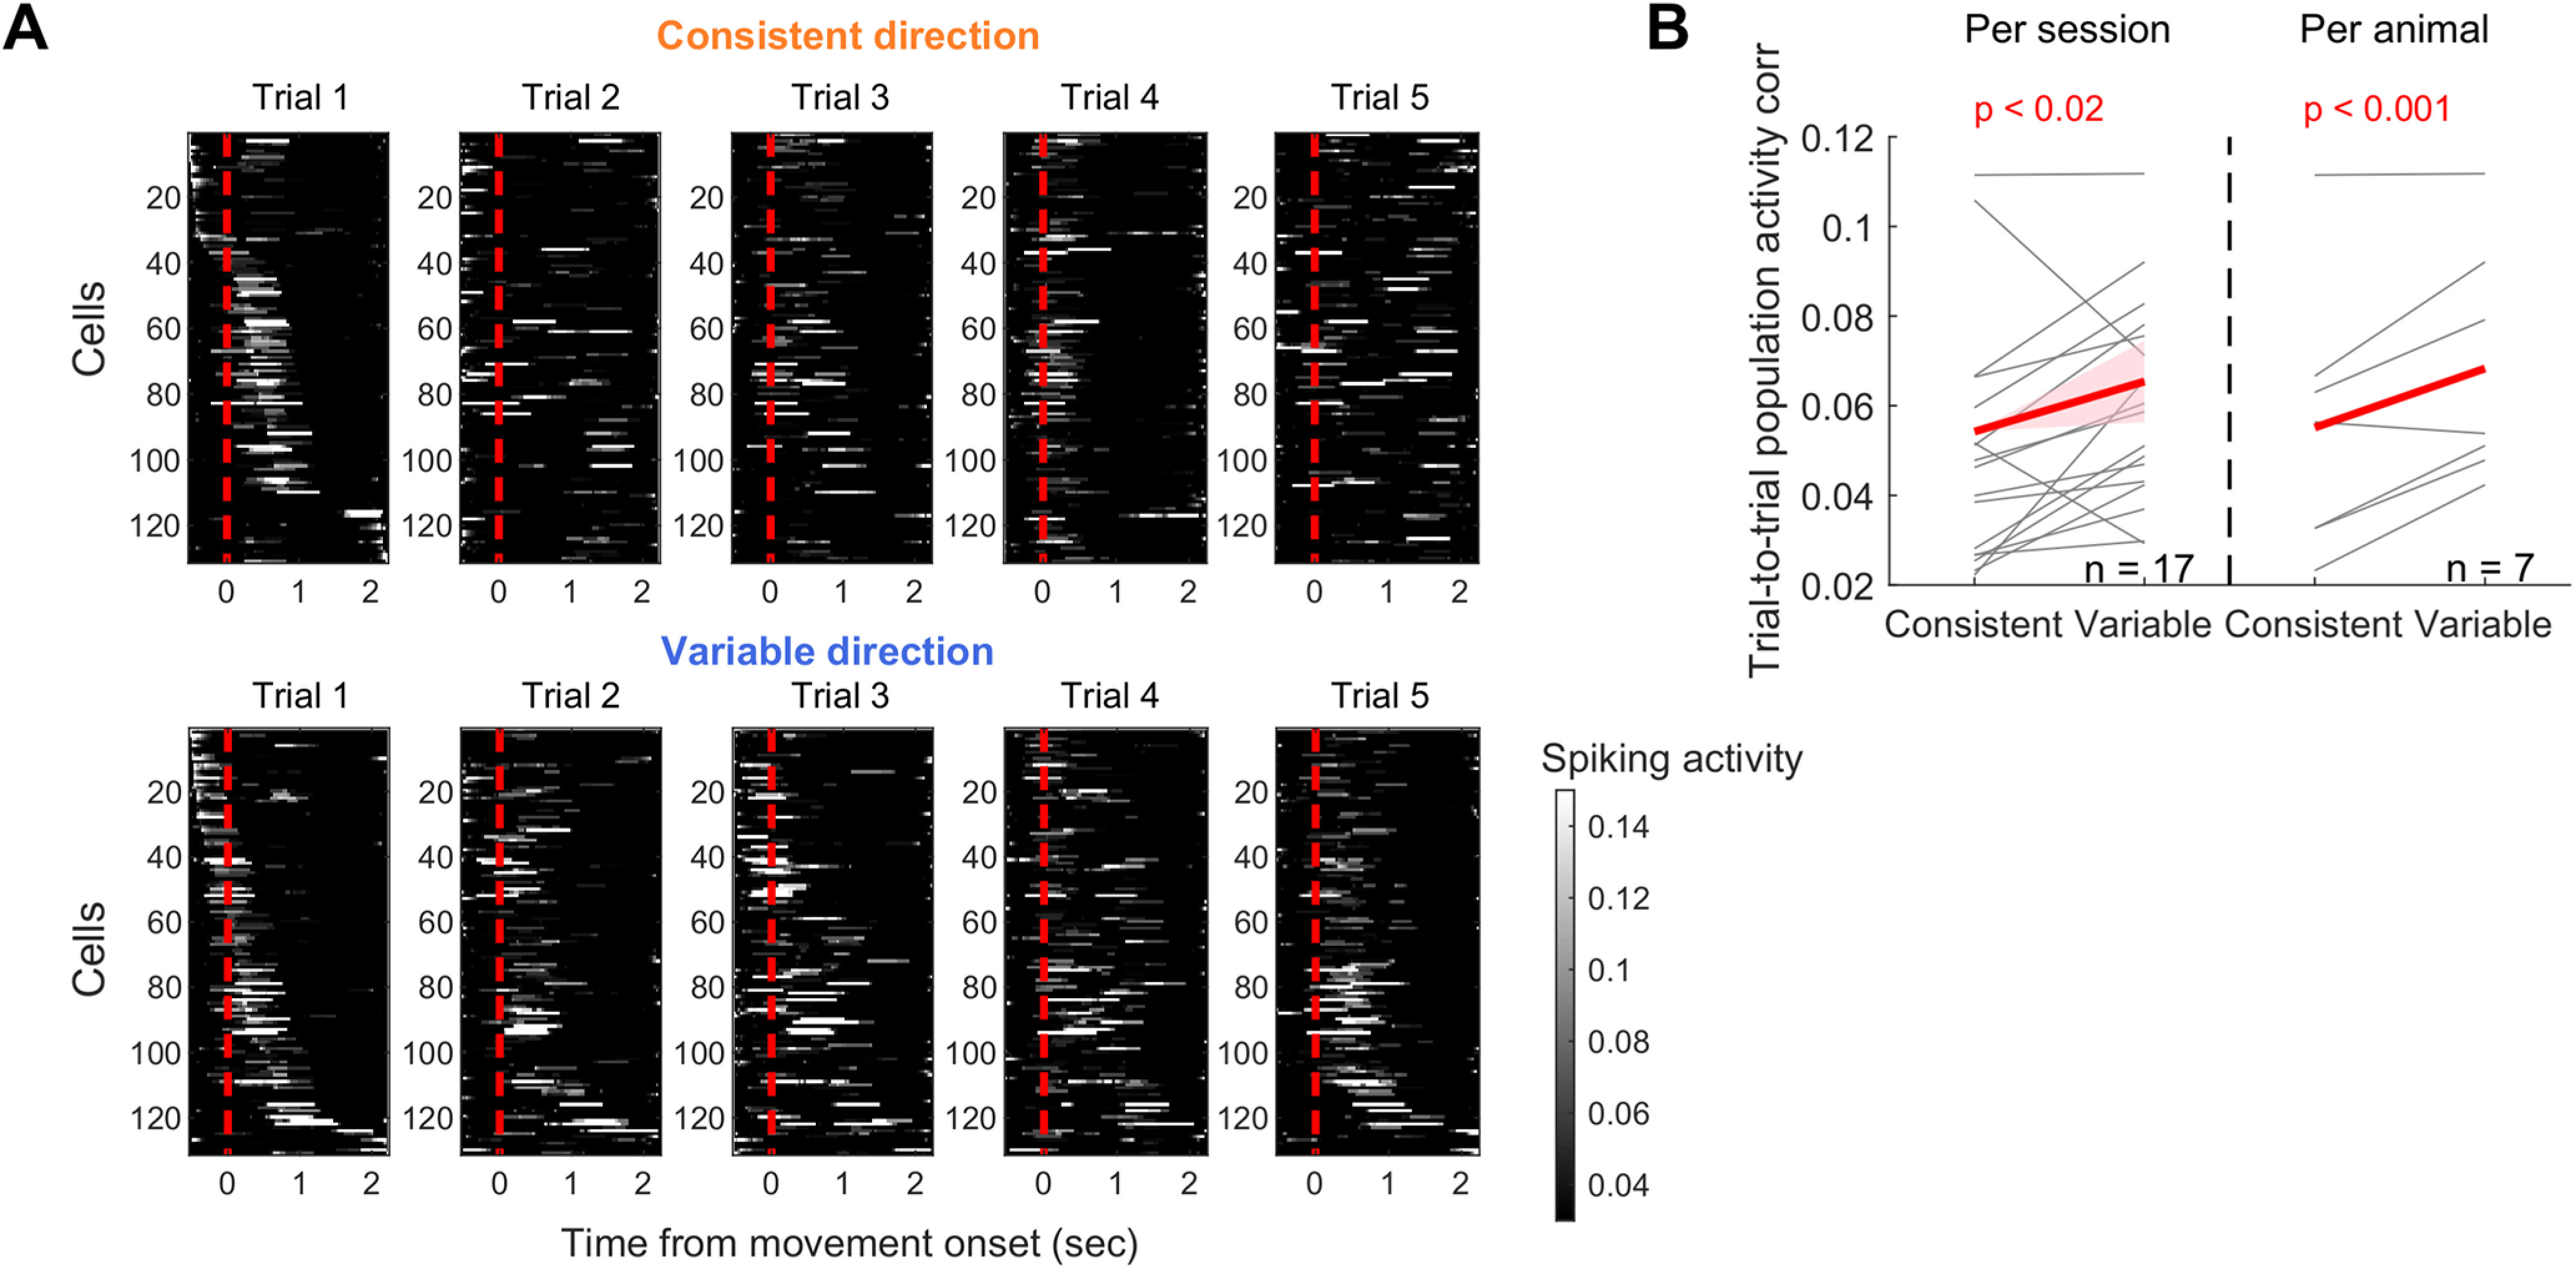
Figure 9.

The consistency of M1 population activity modulated by movement consistency. A, M1 population activity during 5 rewarded trials in the consistent (top) versus variable (bottom) directions. Each row of the heat map represents a single neuron, and neurons are sorted based on the time of their peak activity in the first trial. B, The trial-to-trial population activity correlation for the consistent versus variable directions. The same illustration format and statistical tests as in Figure 7C.
