Figure 1.

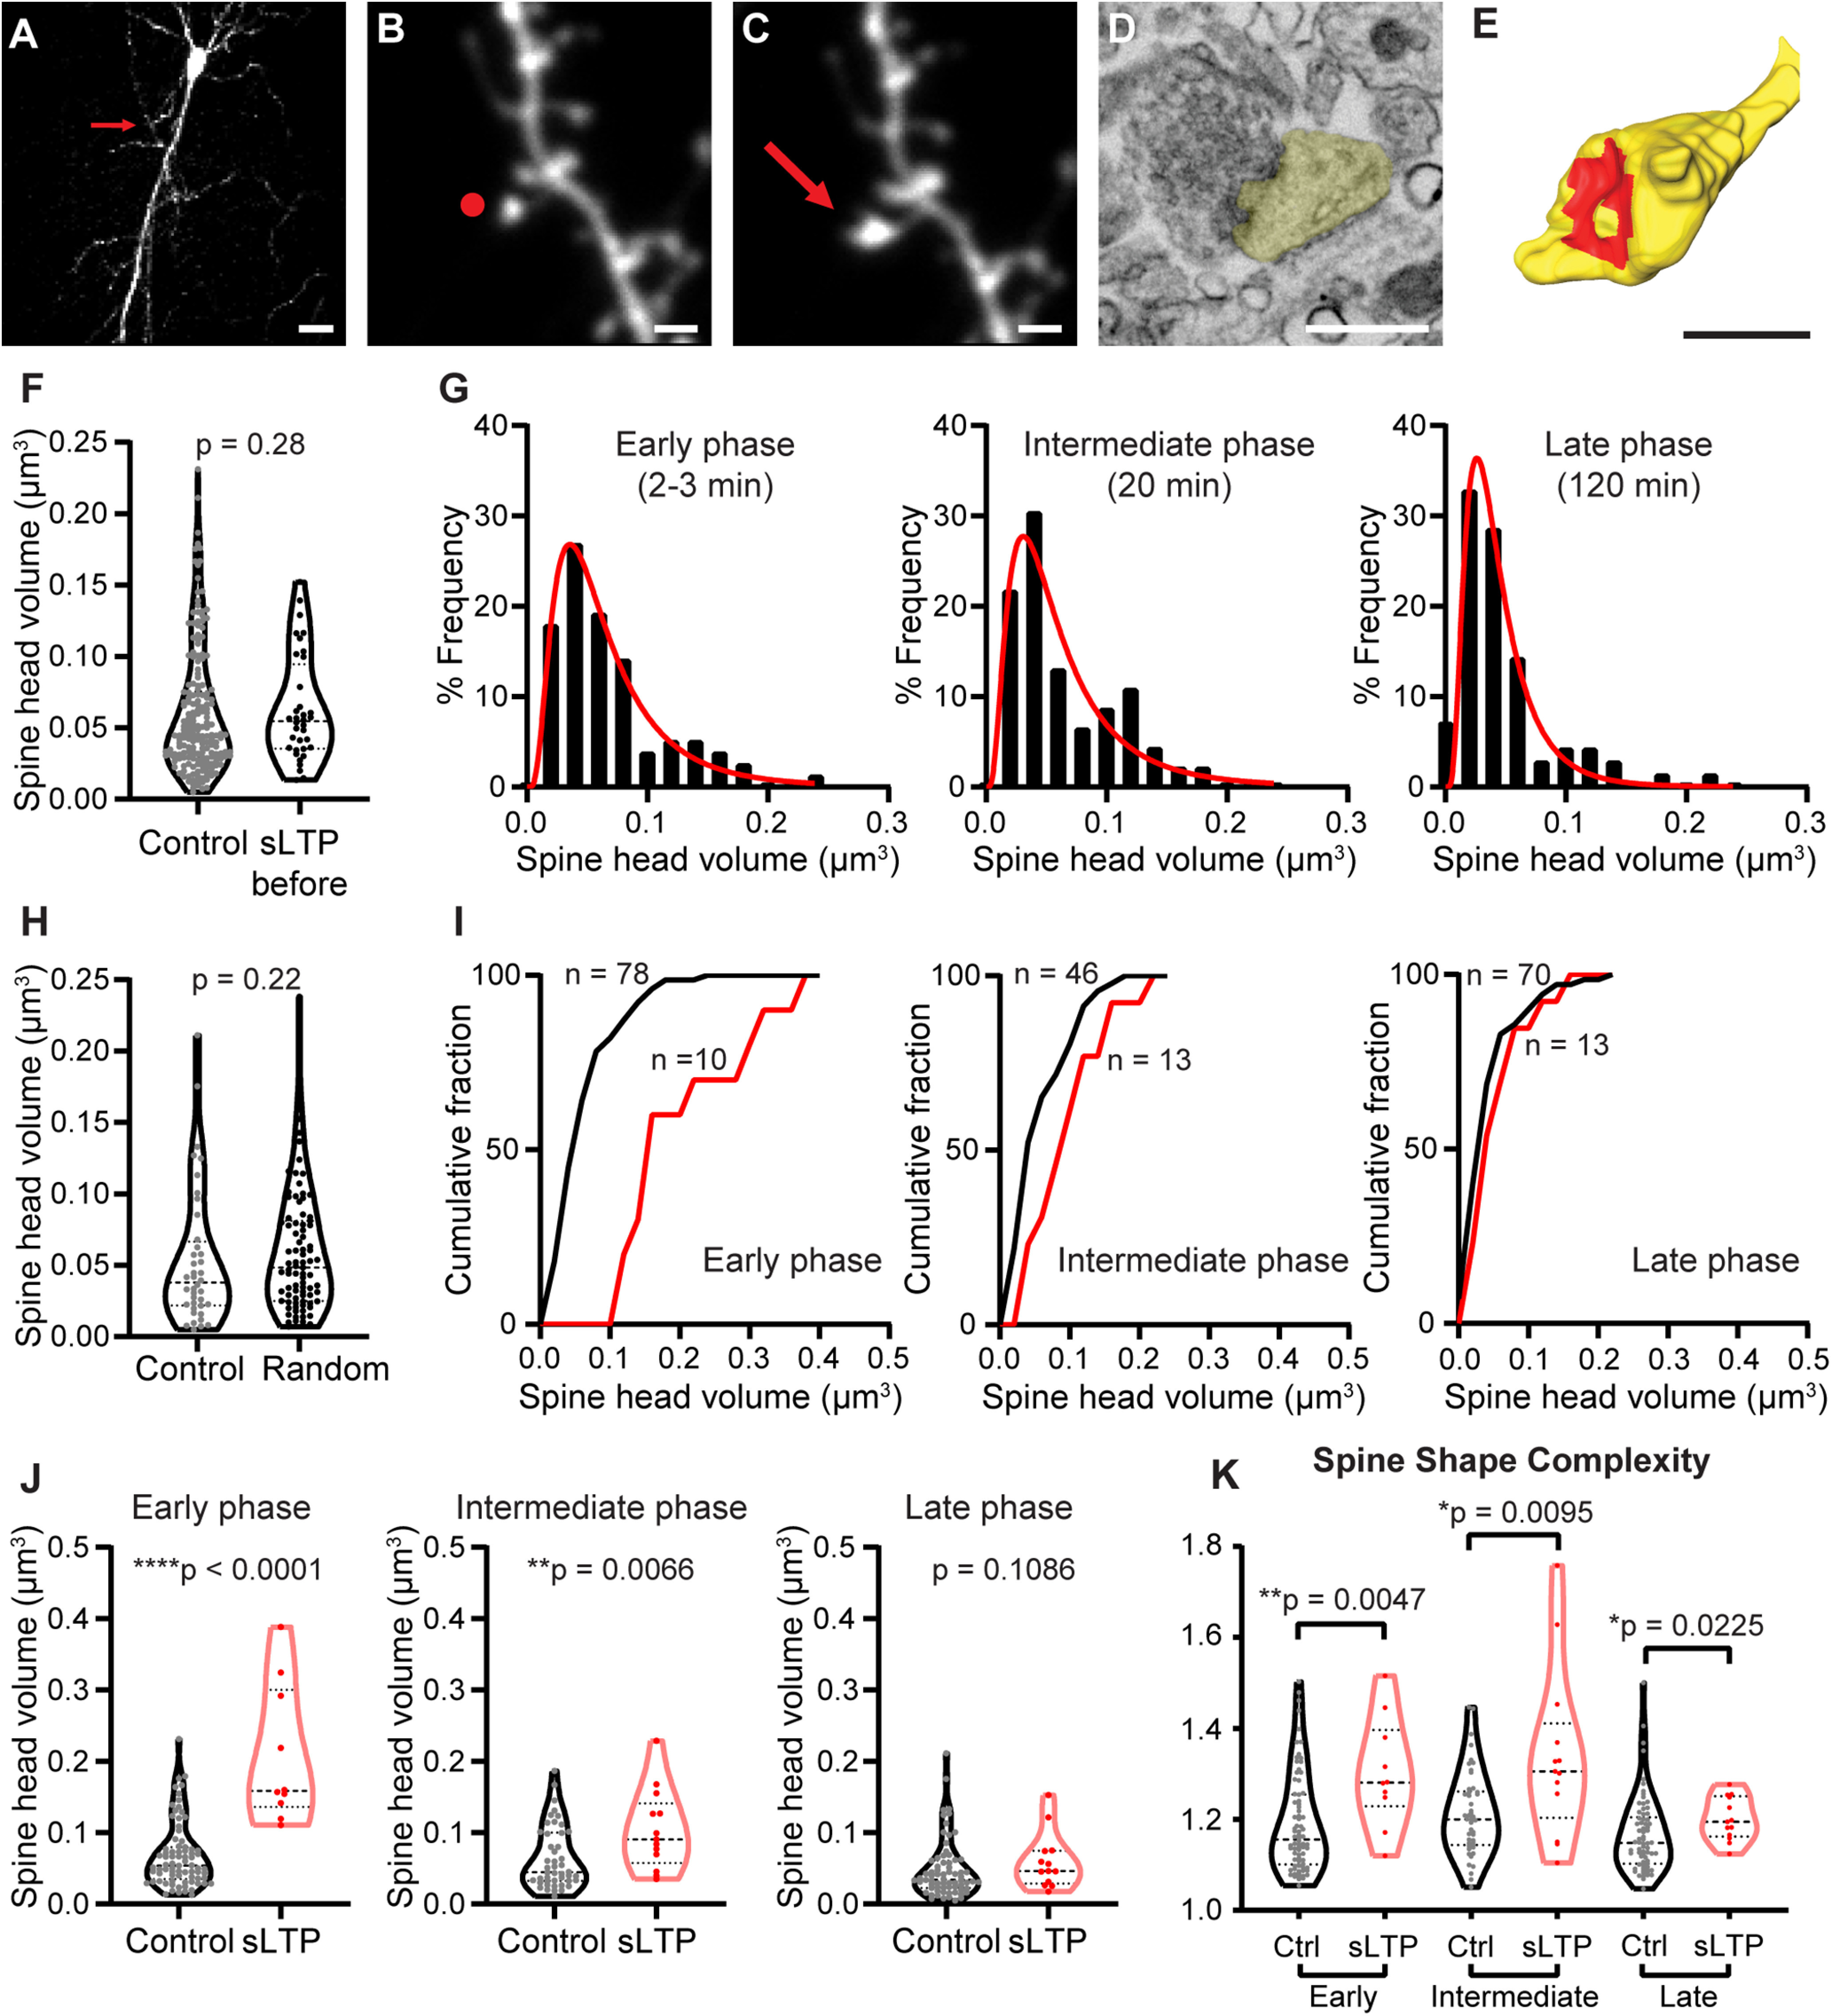
2P glutamate uncaging at single spine induces spine expansion. A, 2P image of an EGFP+ CA1 pyramidal neuron in mice organotypic hippocampal slice selected for glutamate uncaging. Red arrow points to the location of target spine. Scale bar, 20 µm. B, C, 2P images of a dendritic spine before (B) and after (C) 2P glutamate uncaging stimulation. Red dot in B shows the uncaging position, and red arrow in C points to the enlarged dendritic spine. Scale bar, 1 µm. D, A 4 nm/pixel high-resolution SEM image taken with an InlensDuo detector shows detailed ultrastructure of the modulated dendritic spine in C. Spine head is shown in yellow. Scale bar, 0.5 µm. E, 3D reconstruction of the same dendritic spine shown in D. Spine head is shown in yellow, and PSD is shown in red. Scale bar, 0.5 µm. The full workflow for correlative light and electron microscopy is shown in Extended Data Figure 1-1. F, The volume of control spines was similar to the volume of sLTP spines before stimulation. Welch's t test was used on log-transformed data. G, Histograms with log-normal distribution fit curves of raw spine head volume for control spines in early, intermediate, and late phases of sLTP. H, Spine head volume for control spines and random spines located >10 µm from sLTP spine at late phase of sLTP. Welch's t test was used on log-transformed data. I, Cumulative distribution of raw spine head volume for control and sLTP spines in early, intermediate, and late phases of sLTP. J, Spine head volume for control and sLTP spines in early, intermediate, and late phases of sLTP. Welch's t test was used on log-transformed data. K, Spine shape complexity index for control (Ctrl) and sLTP spine at early, intermediate, and late phases of sLTP. Mann–Whitney t test was used. Raw measurements for spine parameters and 3D reconstruction for each spine is shown in Extended Data Figure 1-2. *p < 0.05, **p < 0.01, ****p < 0.0001.
