Figure 3.

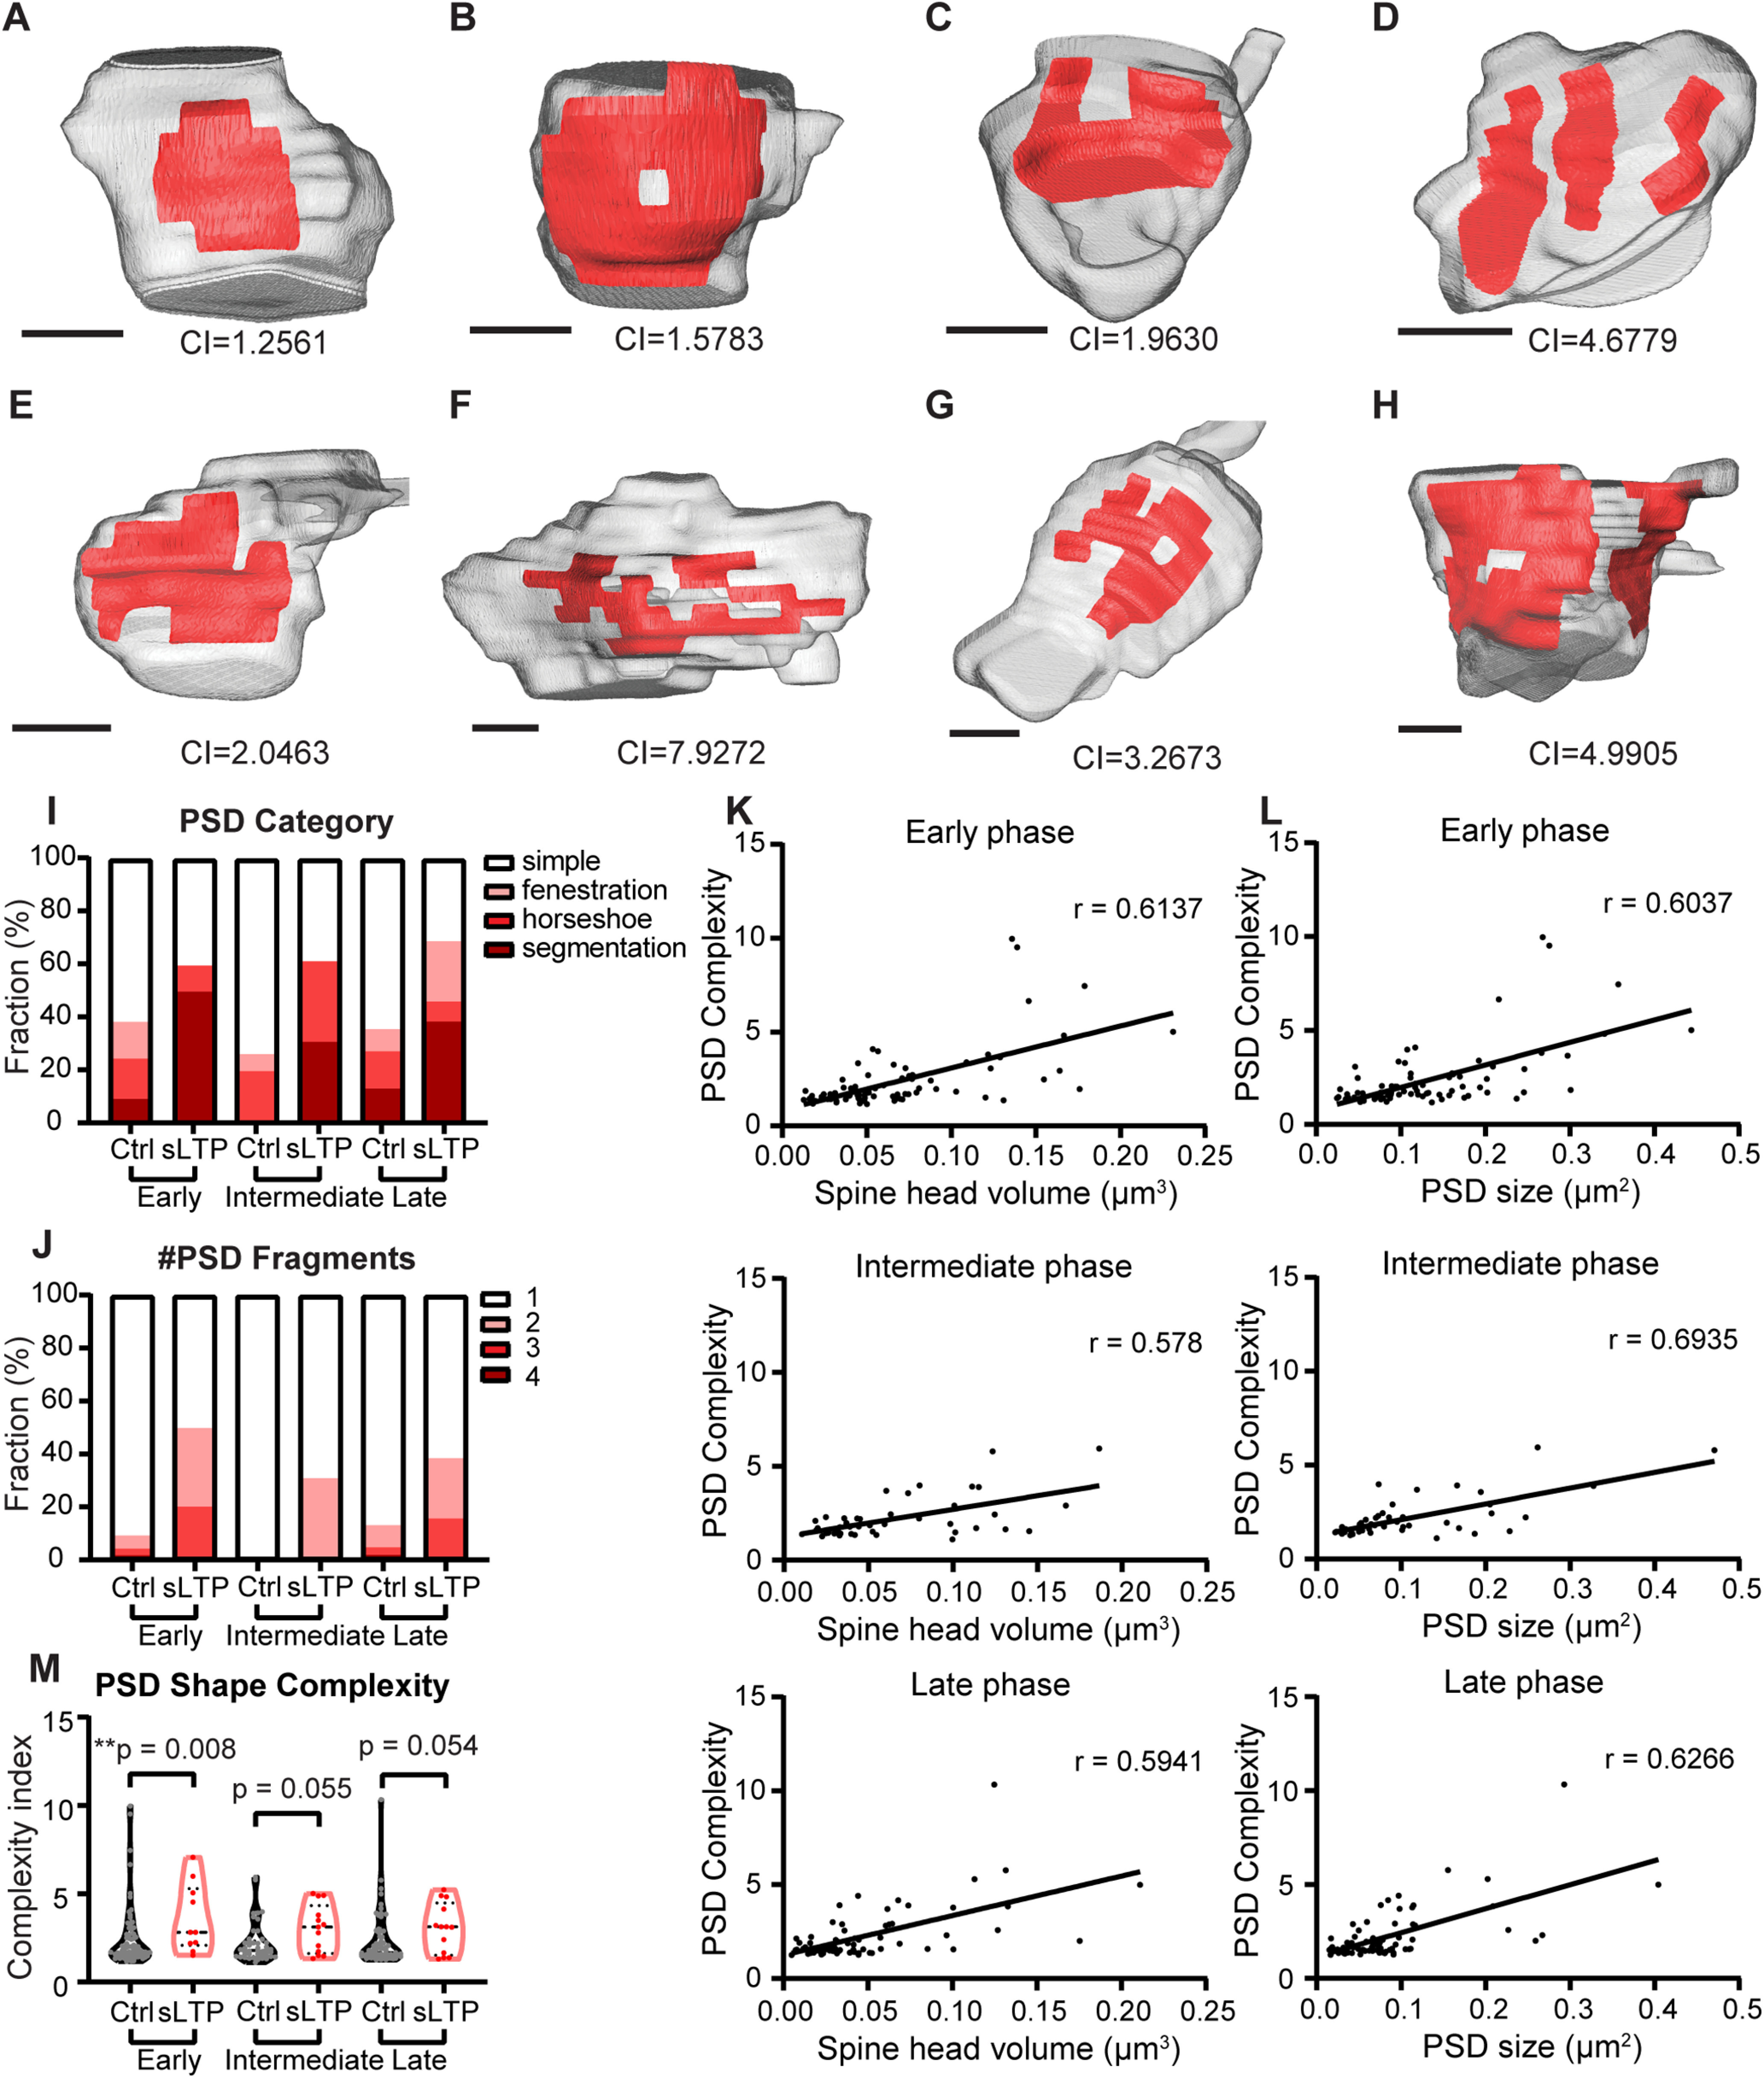
sLTP induces increased PSD complexity. A–H, 3D reconstruction of example spines (gray) containing PSD (red) with different complexity indexes (CIs) and different shape categories: simple (A), fenestration (B), horseshoe (C), segmentation (D), irregular horseshoe (E, F), and combined shape categories (G, H). Scale bar, 200 nm. PSD CI is shown for individual spine. I, Percentage of spines contains PSD in simple, fenestrated, horseshoe, and segmented categories at early, intermediate, and late phases of sLTP in sLTP and control (Ctrl) spines. J, Percentage of spines containing one to four PSD segments at early, intermediate, and late phases of sLTP. K, L, PSD shape complexity is positively correlated with spine head volume (K) and PSD size (L) in control spines at all phases of sLTP. r, Pearson's correlation coefficient. M, PSD complexity index at early, intermediate, and late phases of sLTP. Mann–Whitney t test was used. **p < 0.01.
