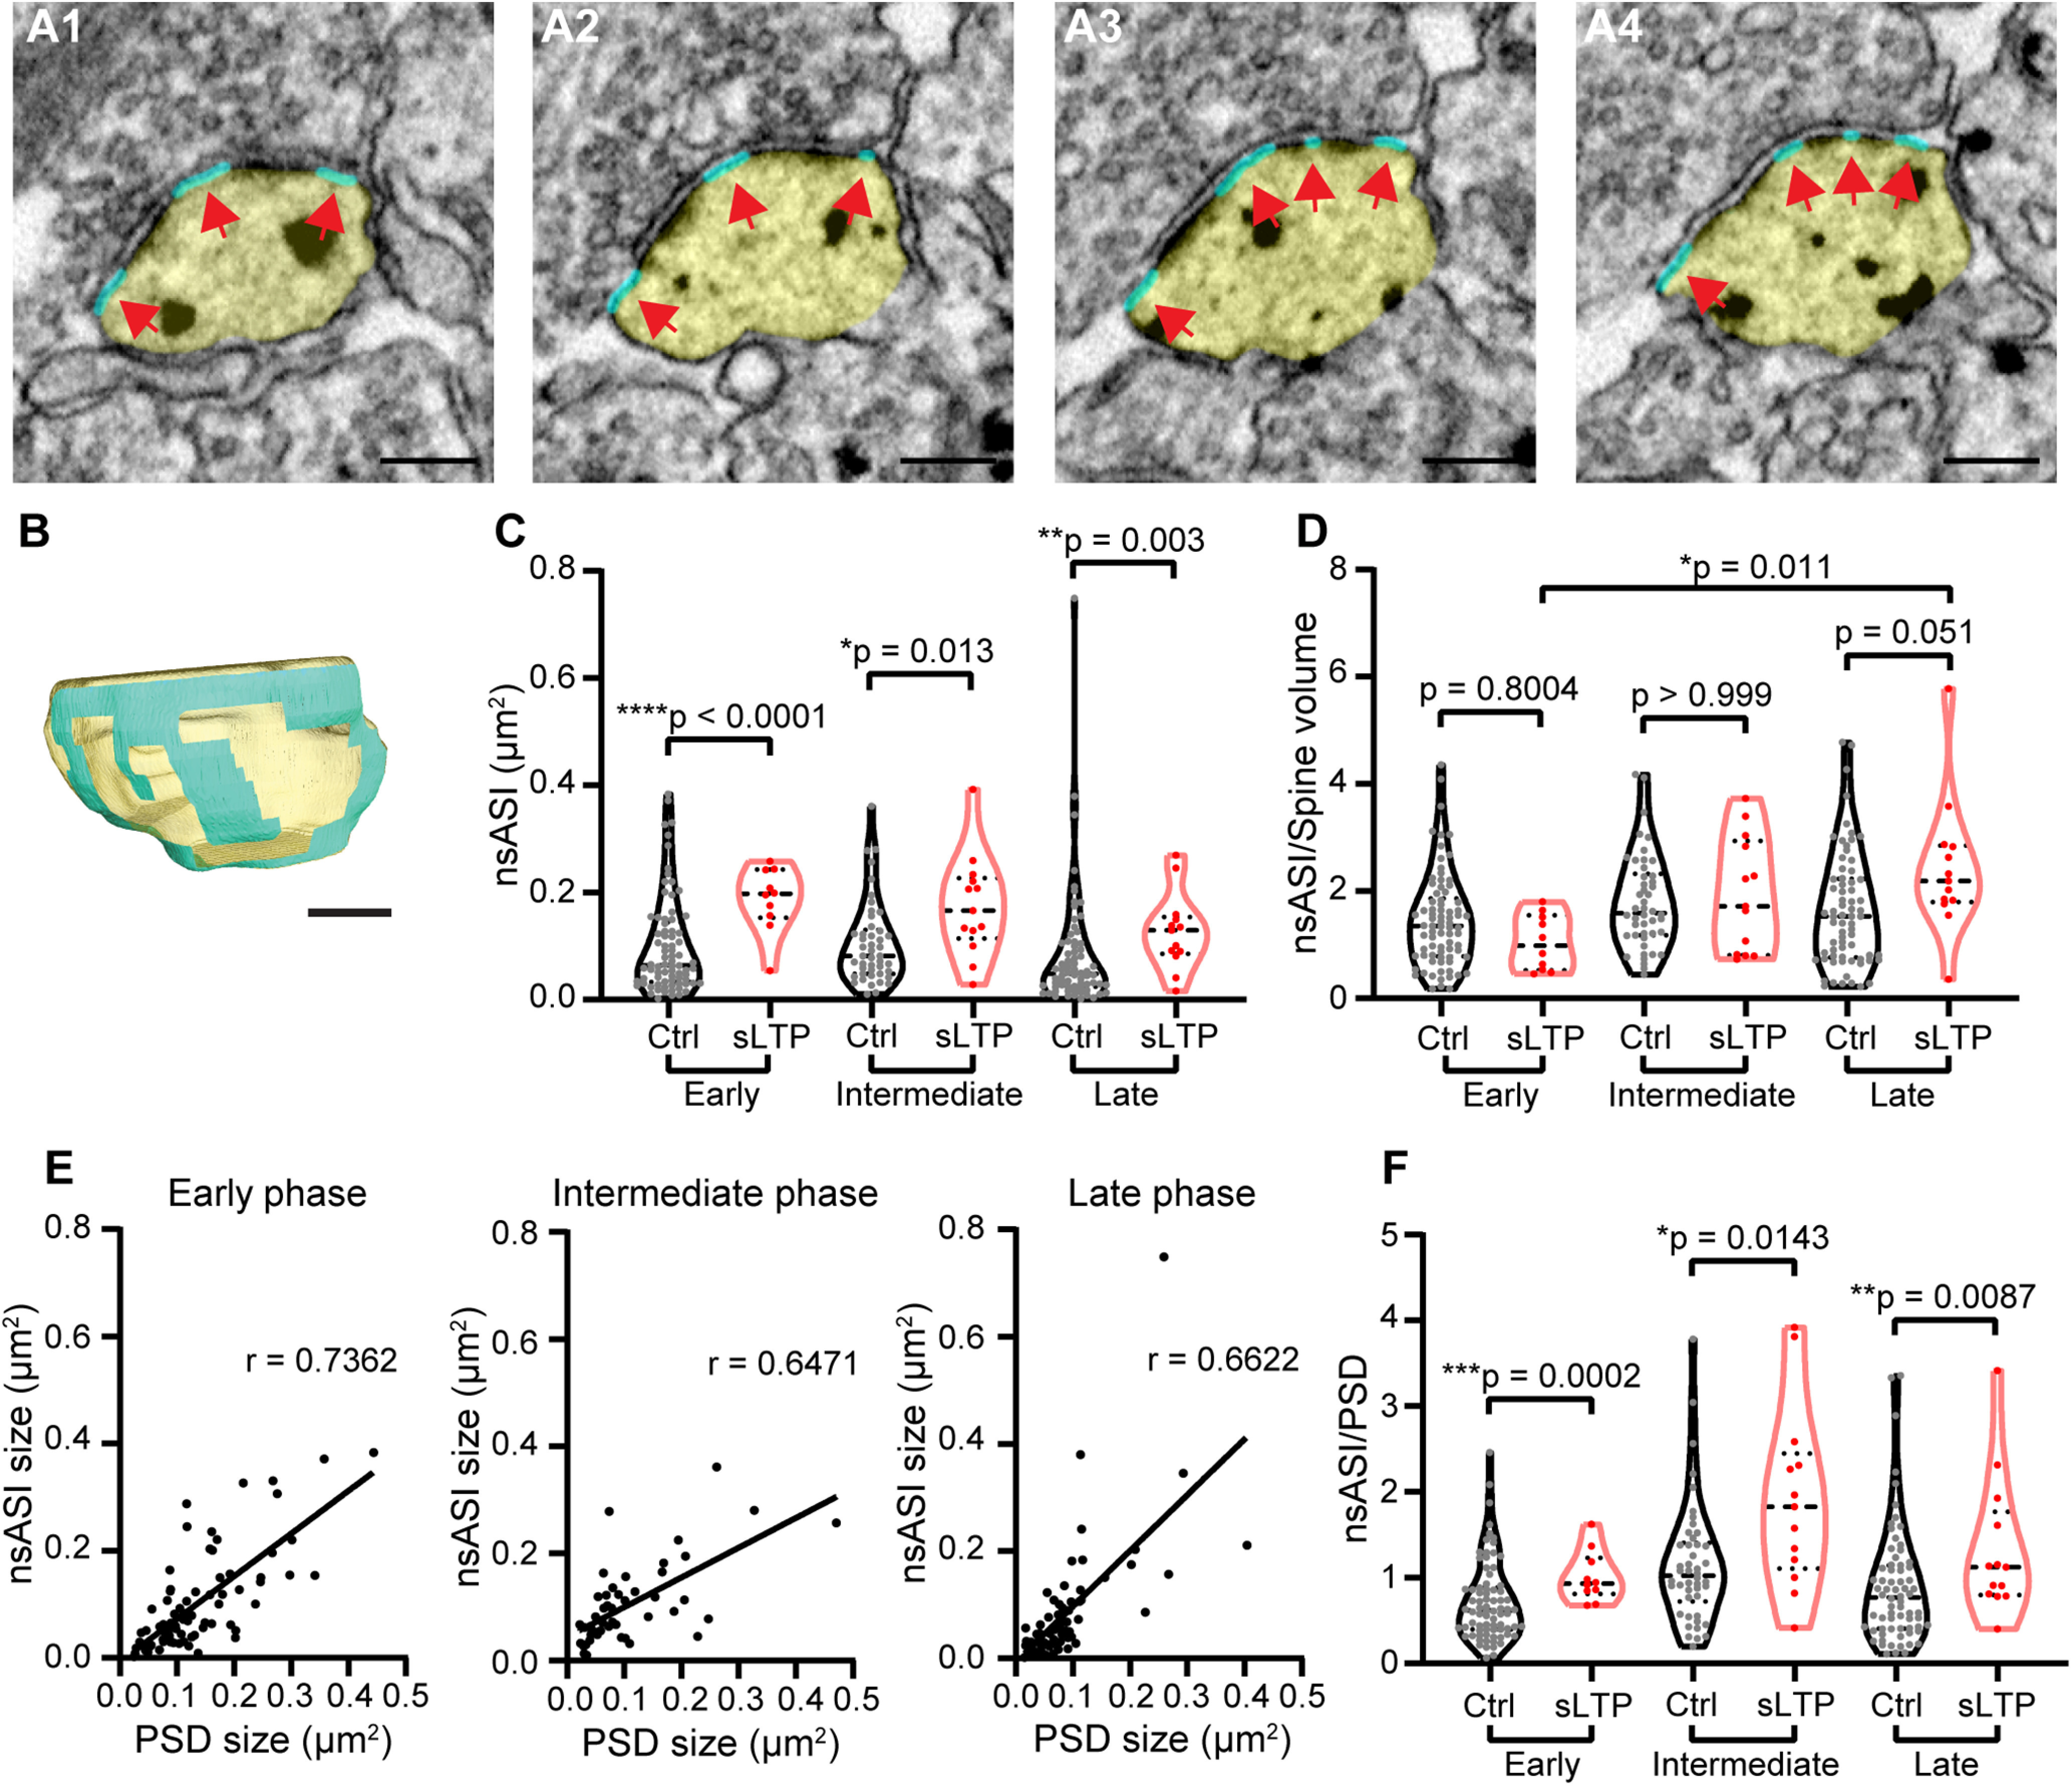
Figure 6.

sLTP induces sustained expansion of nsASI. A, B, Serial images of an example spine (A) and 3D reconstruction of the example spine (B) with spine head shown in yellow and nsASI area shown in cyan, pointed out by red arrows. Scale bar, 200 nm. C, nsASI size at early, intermediate, and late phases of sLTP. Welch's t test on log-transformed data. D, Ratio of nsASI area to spine volume at early, intermediate, and late phases of sLTP for sLTP and control (Ctrl) spines. Two-way ANOVA followed by Bonferroni's post hoc test was used for comparison between control and sLTP spines, and Tukey's post hoc test was used for comparison among different phases. E, nsASI size is positively correlated with PSD size in control spines at all phases of sLTP. r, Pearson's correlation coefficient. F, Ratio of nsASI area to PSD area at early, intermediate, and late phases of sLTP. Welch's t test on log-transformed data. *p < 0.05, **p < 0.01, ***p < 0.001, ****p < 0.0001.
