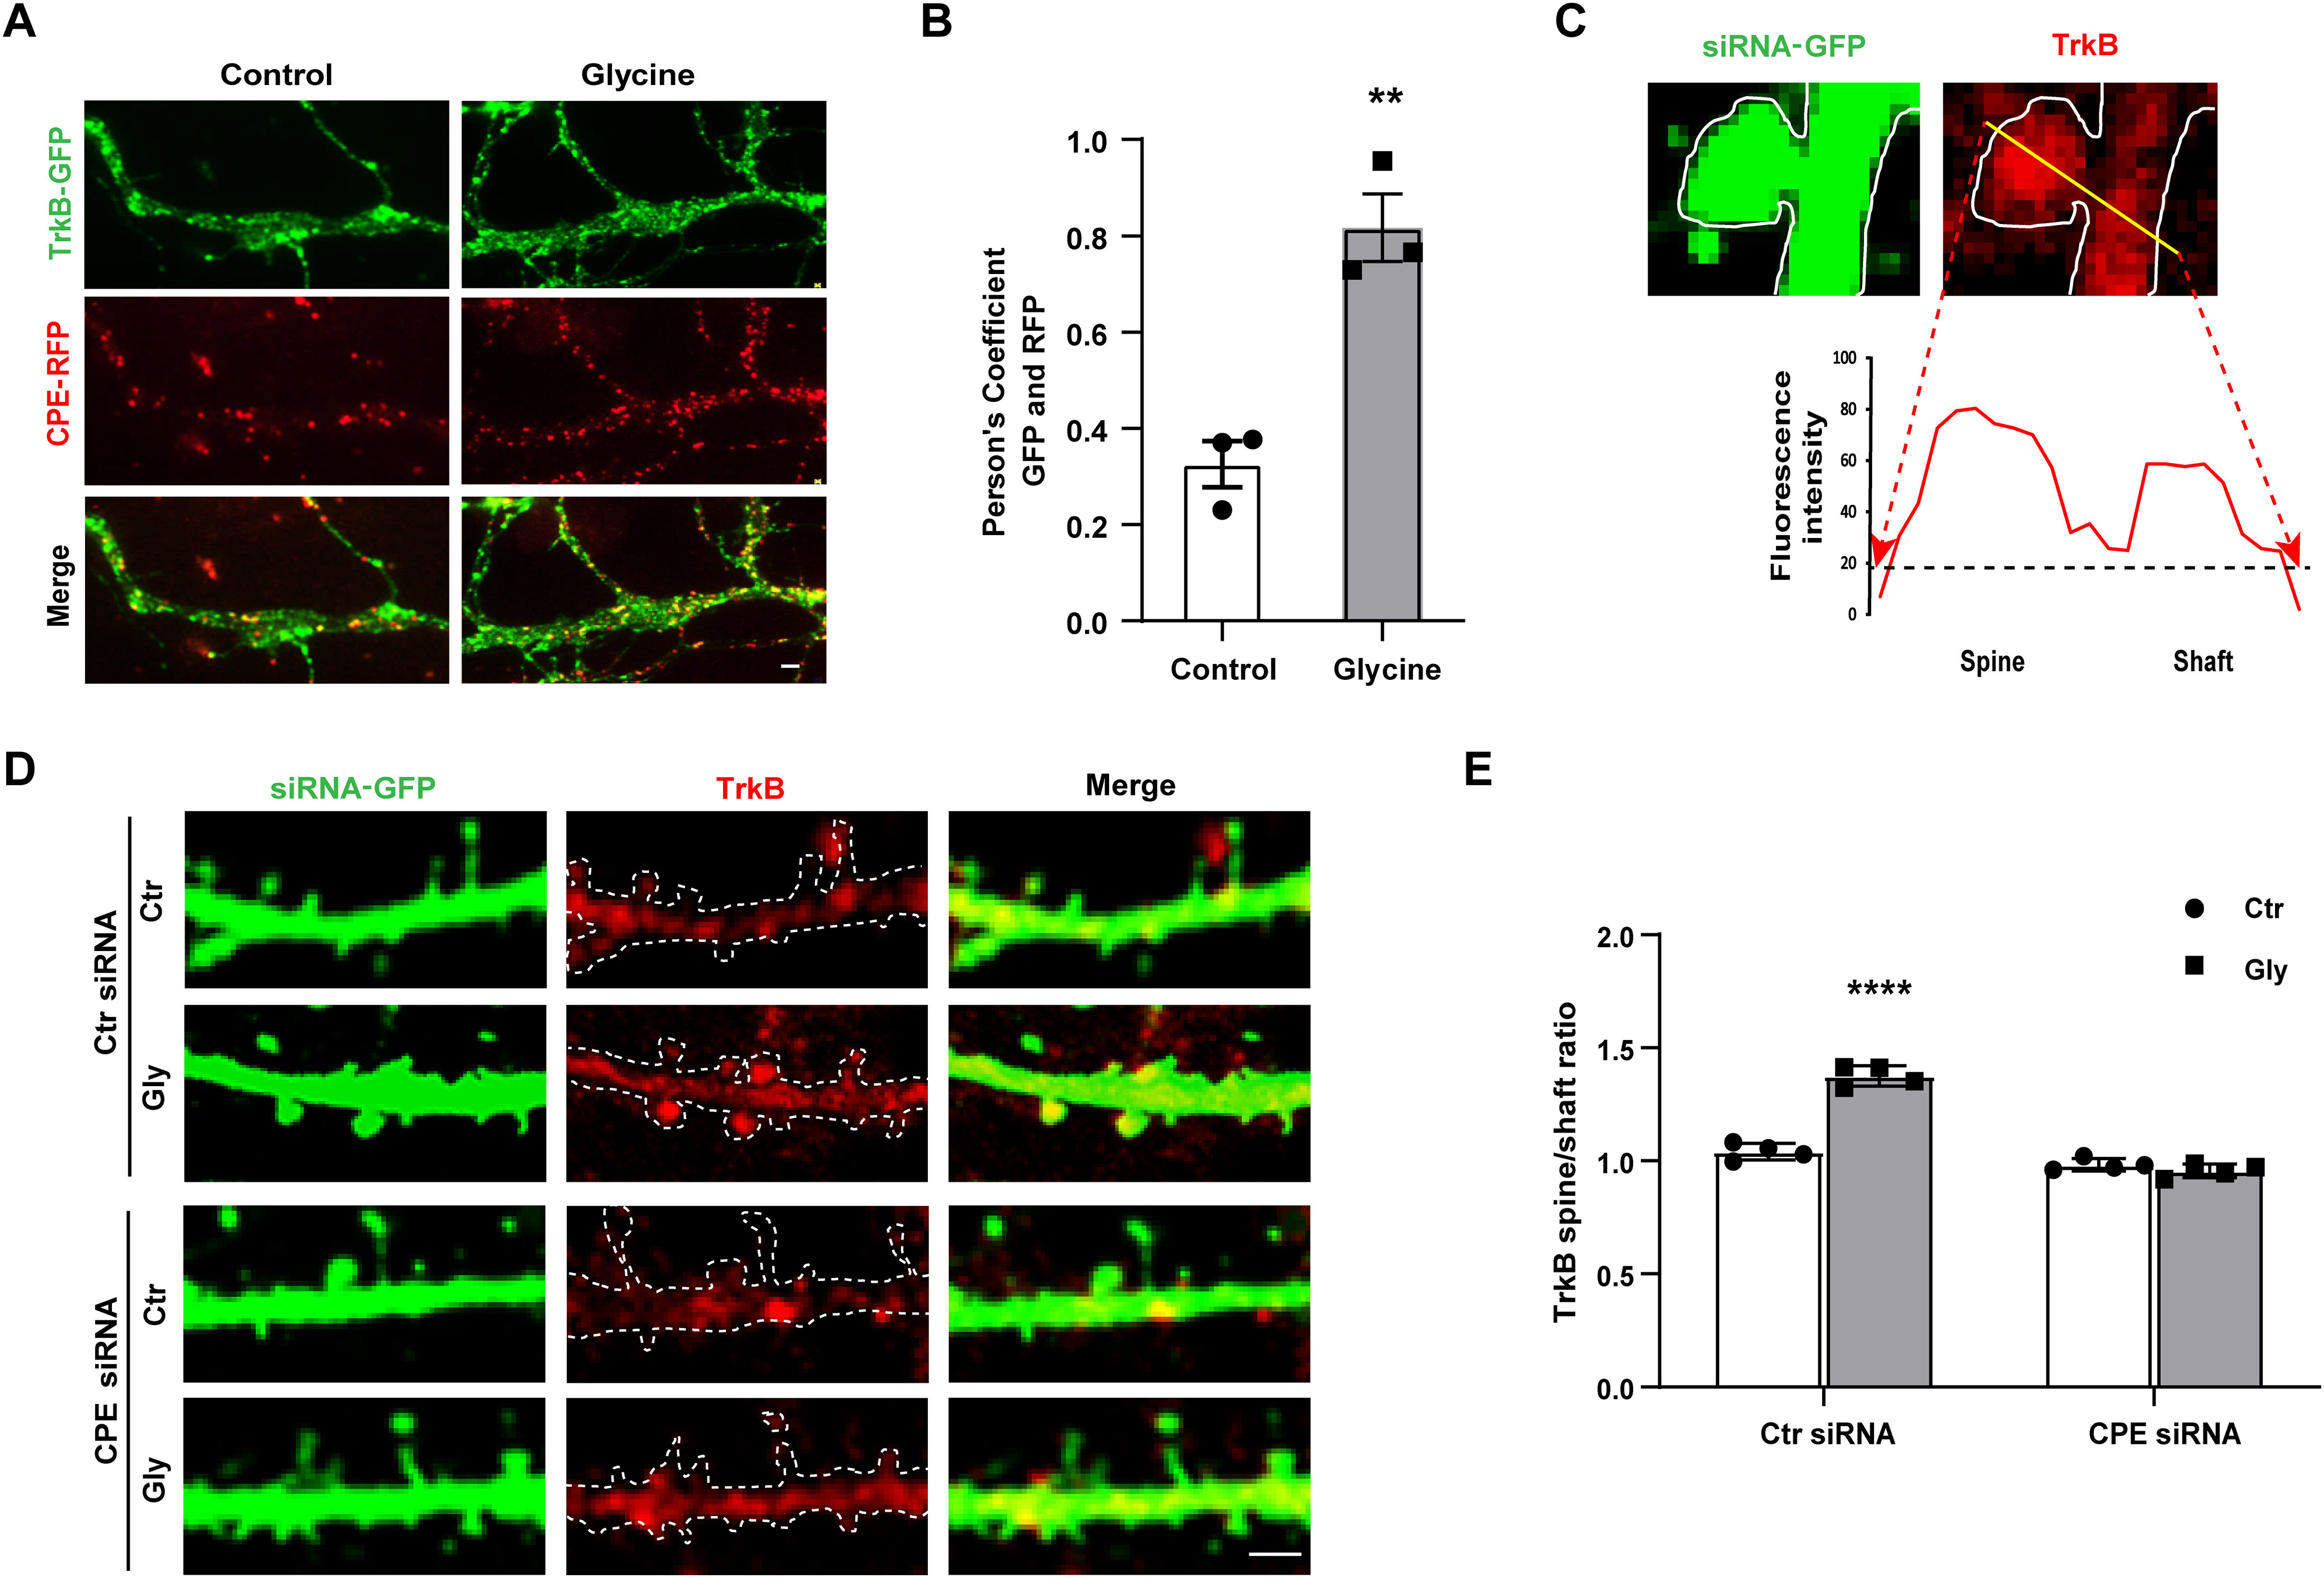
Figure 3.

CPE regulates cLTP-enhanced TrkB surface trafficking and translocation into spine. A, Representative TIRF images are shown for hippocampal neurons coexpression of CPE-RFP and TrkB-GFP, in which yellow color points the doubled positive of CPE and TrkB. Scale bar, 2 μm. B, Colocalization of CPE and TrkB was quantified (unpaired t test, t = 5.784, df = 4, **p = 0.0203; n = 4). C, Representative line plot analysis of TrkB receptor (594 signal, red color) across a spine and the adjacent dendritic shaft of siRNA-GFP transfected neurons, as indicated. Values for TrkB receptors were taken from the fluorescence intensity peaks after background subtraction (yellow line). Scale bar, 2 μm. D, Representative immunofluorescence images of total TrkB receptor across a spine and the adjacent dendritic shaft of siRNA-GFP transfected neurons on cLTP stimuli. E, Quantitative analysis of the ratio of TrkB fluorescence in spines and dendrites after normalization (15 dendrites/cell, 15–18 µm2/dendrite). Two-way ANOVA with Bonferroni's multiple comparisons test, F(1,12) = 104.4, ****p < 0.0001; n = 4. All the data are presented as mean ± SEM (n ≥ 25 cells for each condition per experiment).
