Figure 5.

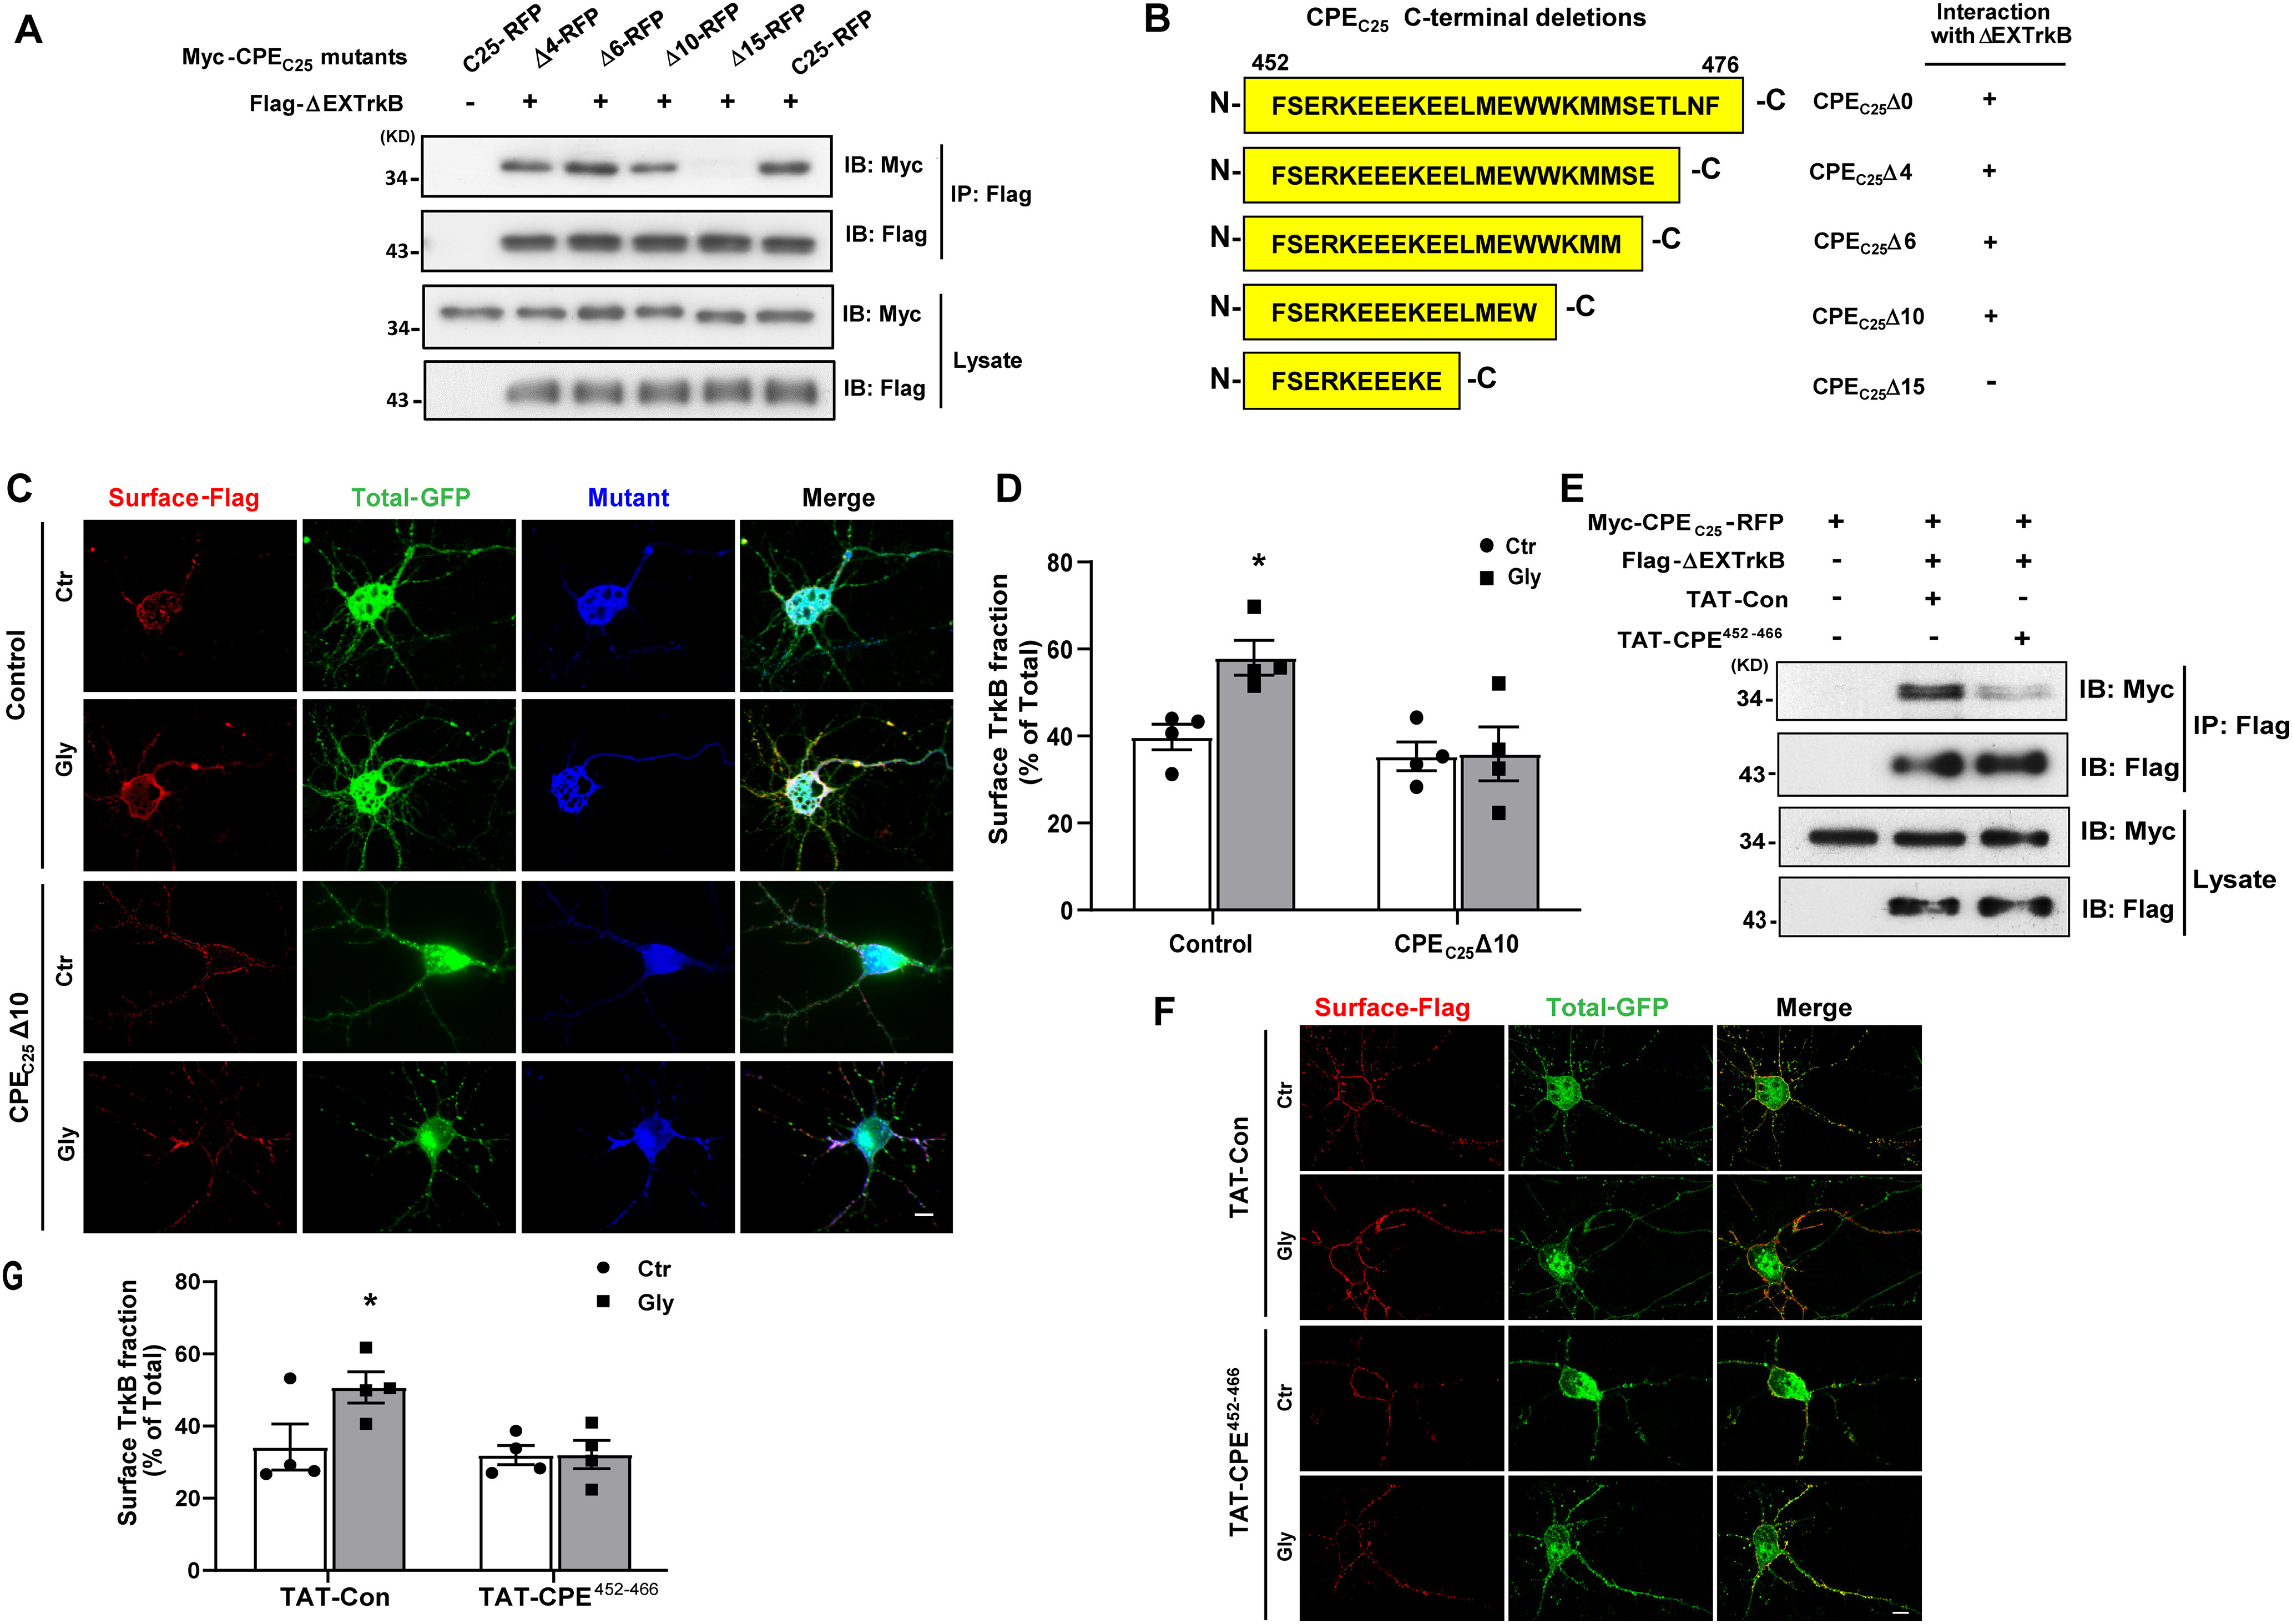
Identification of the key binding domain in CPE interacting with TrkB that mediated activity-dependent surface TrkB recruitment. A, Co-IP was performed in lysates of HEK 293 cells expressing Flag-TrkBΔEX and Myc-CPEC25 truncated mutants. B, Summary of CPE-truncated mutants used in A and a summary of the TrkBΔEX interactions with the mutants of CPE. C, Ratiometric fluorescence assay was performed to examine the influence of CPEC25Δ10-RFP on cLTP-induced surface recruitment of TrkB receptors. Representative epifluorescence images were shown. Scale bar, 10 μm. The Control and CPEC25Δ10-RFP constructs all express fused RFP, and we only captured images of RFP-positive neurons (pseudo blue color). The total TrkB receptors were fused with GFP (green color). The surface TrkB stained with M2 antibody followed by Cy5-conjugated goat anti-mouse antibody (pseudo red color). D, Quantification of TrkB surface levels by the ratio of red to green fluorescence intensity in C (two-way ANOVA with Bonferroni's multiple comparisons test, F(1,12) = 4.193, *p = 0.0225; n = 4). E, TAT-CPE452-466 inhibits the interaction between CPEC25 and TrkBΔEX. HEK293 cells were transfected with Myc-CPEC25 and FLAG-TrkBΔEX. After 2 d cells were treated with TAT-Con or TAT-CPE452-466 (5 μm) for 30 min before lysed. The interaction between CPEC25 and TrkBΔEX was analyzed by IP using anti-Flag antibodies and followed by immunoblotting with Myc antibodies. F, Ratiometric fluorescence assay was performed to examine the influence of TAT-CPE452-466 peptides on glycine-induced surface recruitment of TrkB receptor. Representative images from the ratiometric fluorescence assay are shown. Scale bar, 10 μm. G, Quantification of TrkB surface levels by the ratio of red to green fluorescence intensity in F (two-way ANOVA with Bonferroni's multiple comparisons test, F(1,12) = 3.266, *p = 0.0481; n = 4). All the data are presented as mean ± SEM (n ≥ 25 cells for each condition per experiment).
