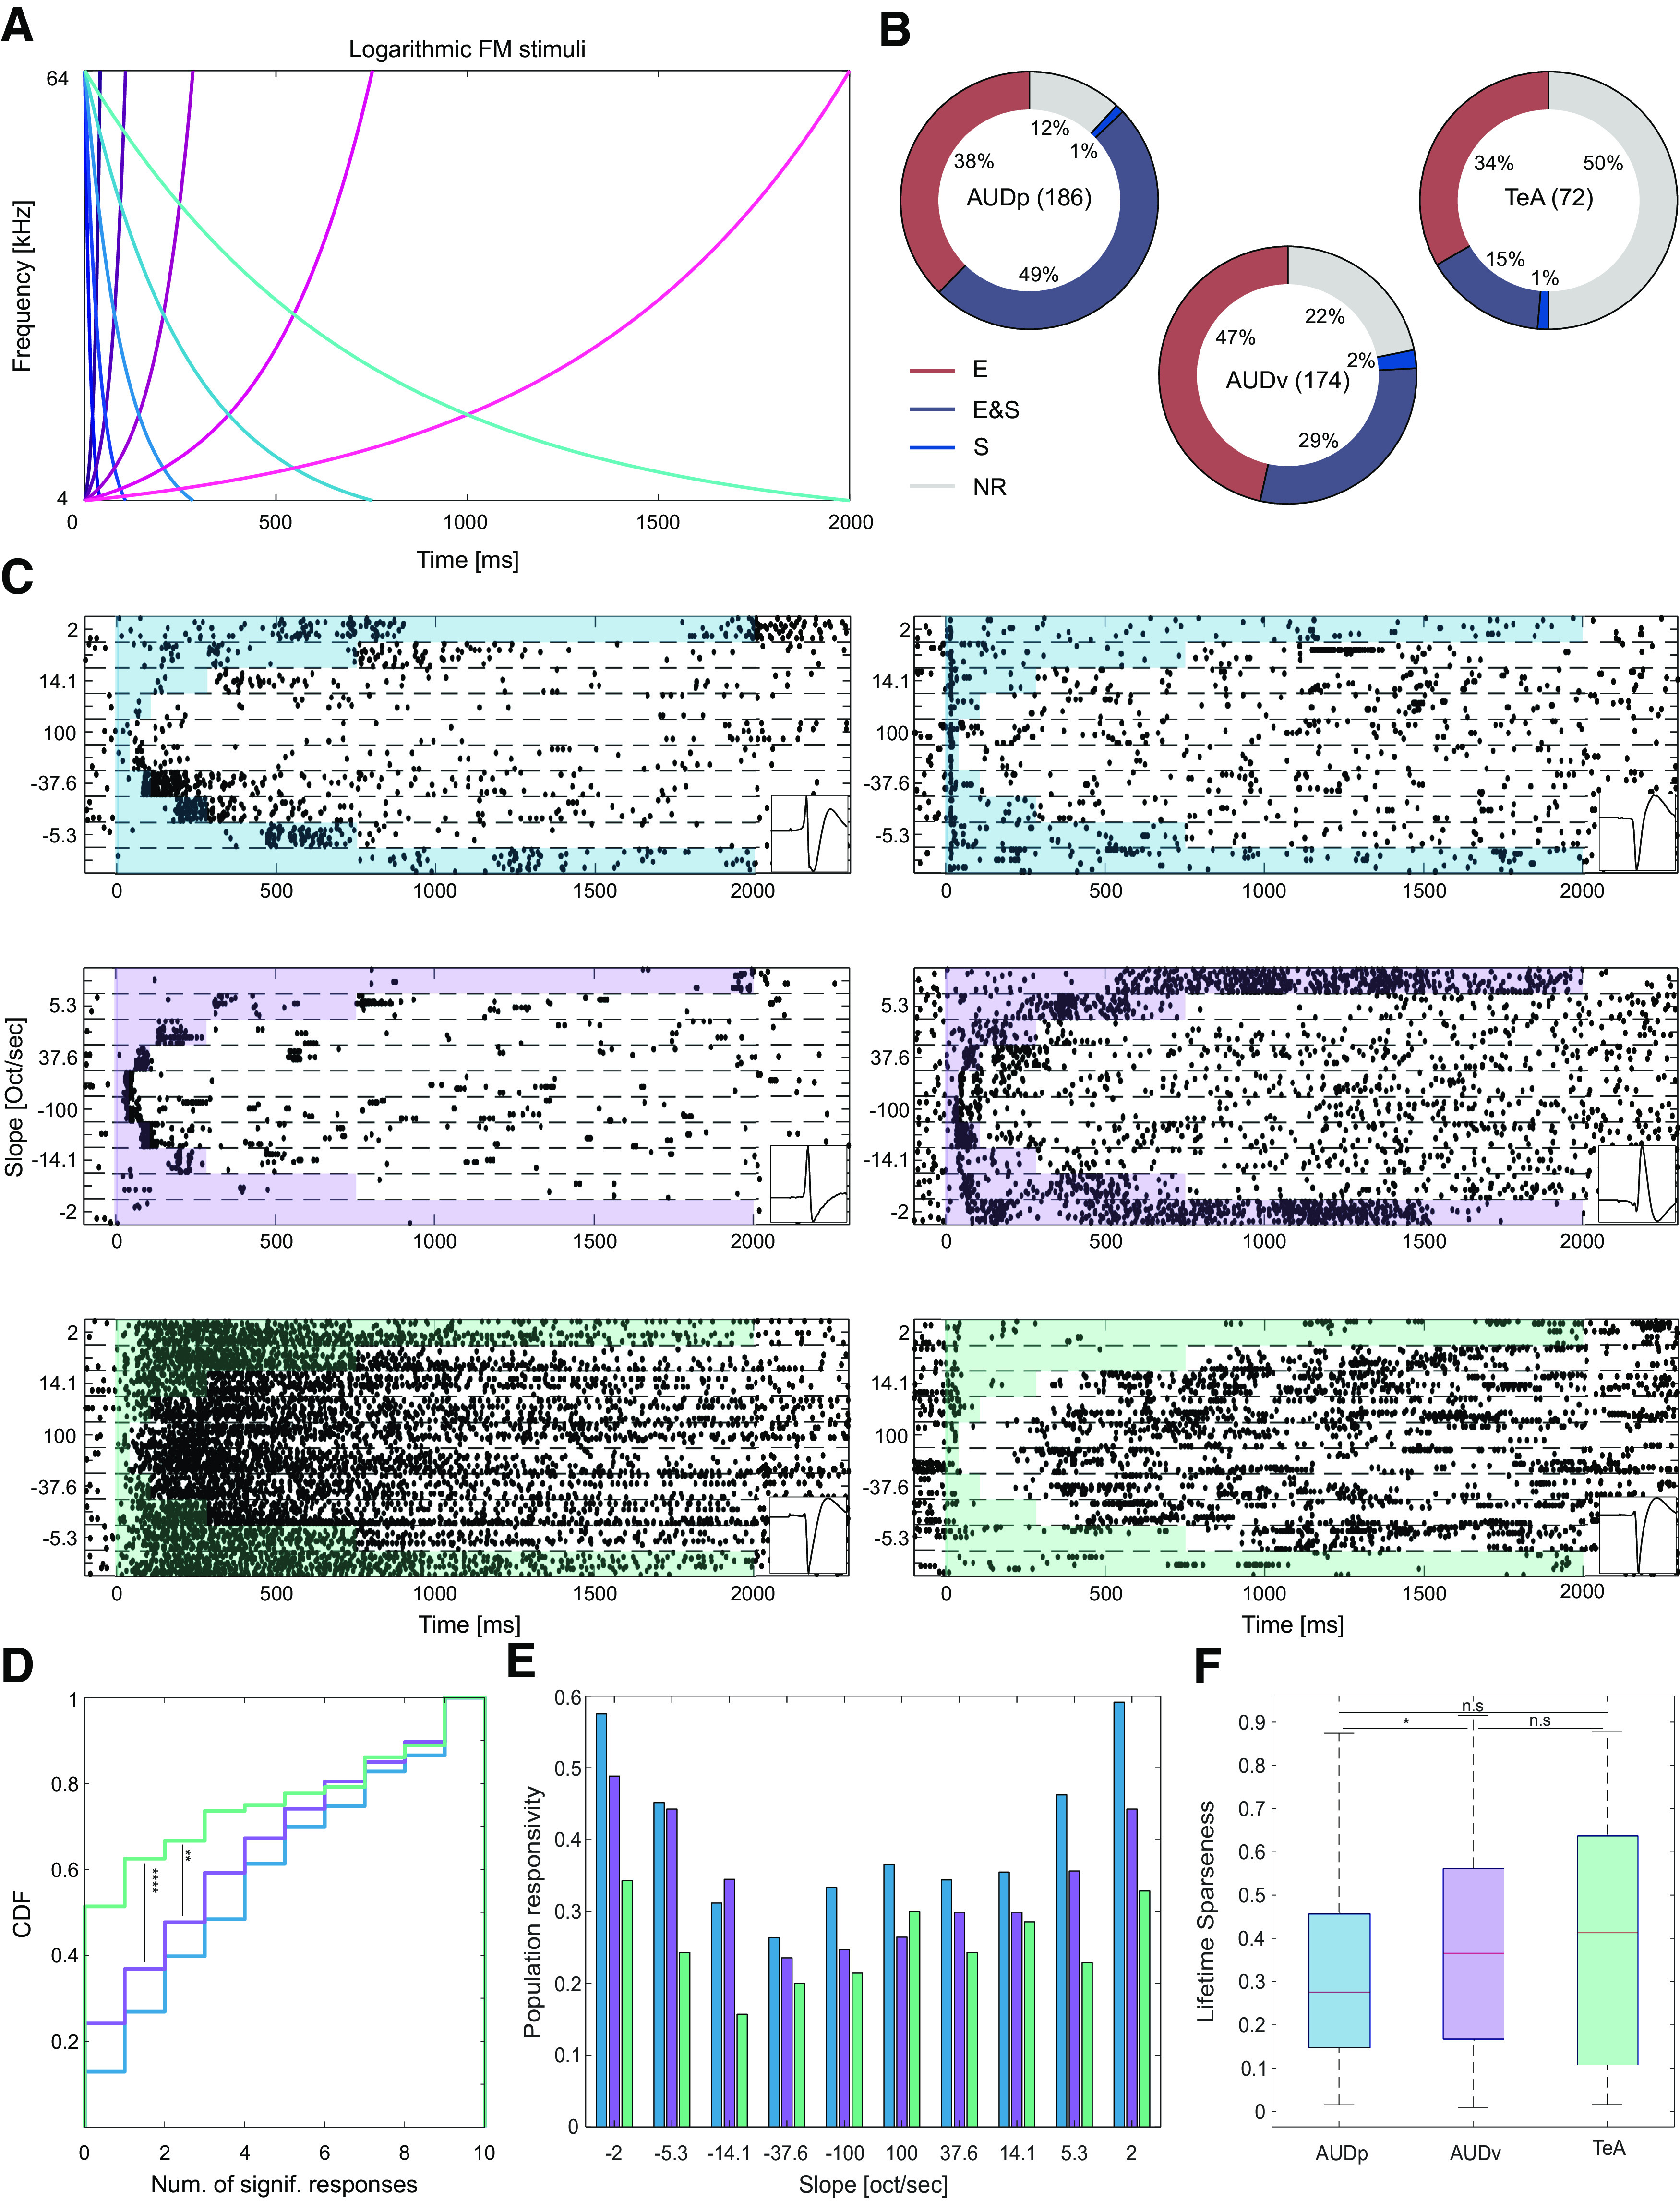
Figure 4.

Basic response to FMs in TeA, AUDp, and AUDv. A, FM stimulus set. Frequency versus time representations of rising (pink palette) and falling (blue palette) logarithmic FM sweeps. Darker colors correspond to larger modulation speeds and shorter stimuli. B, Donut plots summarizing FM response types. E (excited), E and S (excited and suppressed), S (suppressed), and NR (not responding). The numbers of SUs recorded in region are shown in parentheses. In all regions, at least half of the SUs exhibit excitatory responses, with the fraction of excited SUs decreasing along the D-V axis of the cortex (fraction excited SUs: AUDp, 162/186 = 0.87; AUDv, 132/174 = 0.76; TeA, 35/72 = 0.49; H(2) = 42.57 p < 1e-4; Kruskal–Wallis; AUDp vs AUDv p = 0.03, AUDp vs TeA p < 1e-4; AUDv vs TeA p = 0.009; TK HSD test). C, Representative examples of SU FM responses from AUDp (top row), AUDv (central row), and TeA (bottom row). Shaded regions mark the stimulus durations. Panels on the right bottom of each example show the units template waveform. D, CDF showing the number of FM stimuli evoking significant excitatory response [median (IQR): AUDp, 4 (1–7) n = 186, AUDv, 3 (1–6) n = 174, TeA, 0 (0–4.5) n = 72] in SUs of AUDp (blue) AUDv (purple) and TeA (green). Responsivity was lower in TeA compared with both AUDp and AUDv (H(2) = 21.74 p < 1e-4, Kruskal–Wallis; AUDp vs AUDv, p = 0.08 n.s.; AUDp vs TeA, p < 1e-4; AUDv vs TeA, p = 0.008; TK HSD test). E, Population sparseness presented as the response probability of SUs in each region to logarithmic FMs. F, Lifetime sparseness calculated for FM responses [median (IQR): AUDp, 0.28(0.15–0.46) n = 162, AUDv, 0.37 (0.17–0.56) n = 132, TeA, 0.41 (0.11–0.64) n = 35]. Sparseness was lower in AUDp compared with AUDv (H(2) = 6.90 p = 0.03; Kruskal–Wallis; AUDp vs AUDv, p = 0.04, AUDp vs TeA, p = 0.2 n.s.; AUDv vs TeA p = 0.9 n.s.; TK HSD test).
