Figure 7.

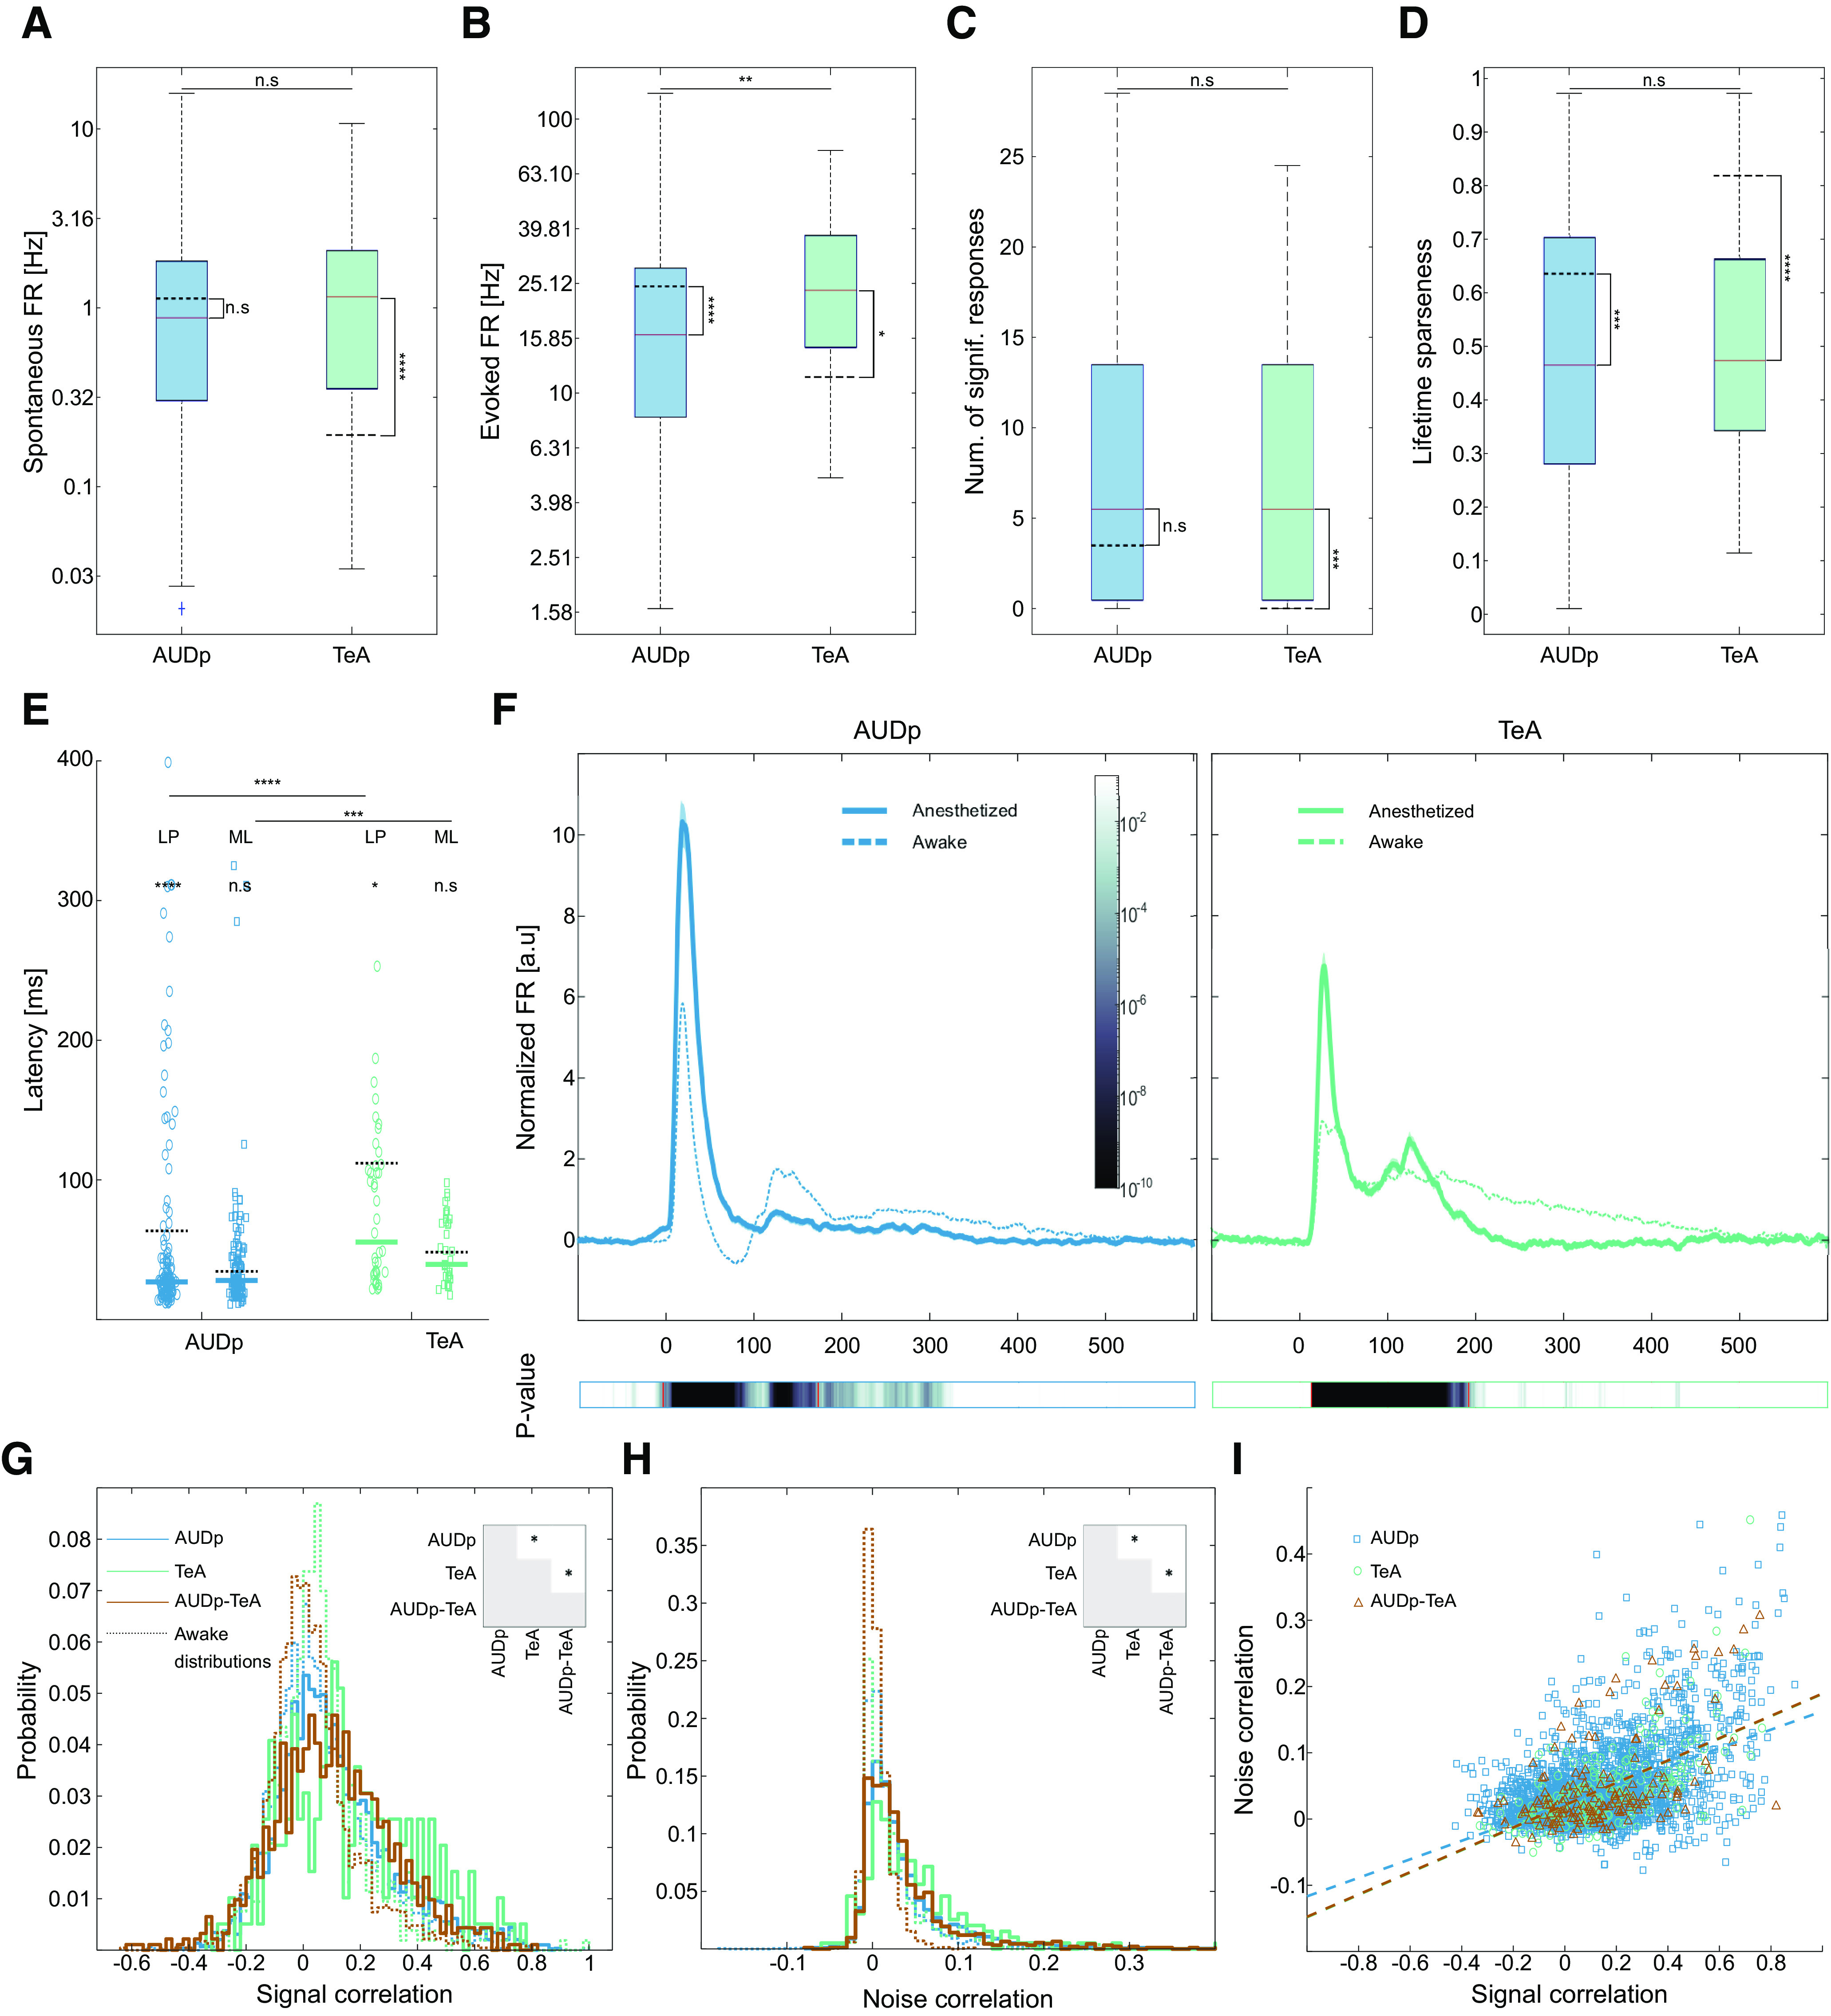
Anesthesia affects TeA and AUDp in distinct ways. A, Spontaneous FRs in anesthetized AUDp and TeA [median (IQR): AUDp, 0.88 (0.30–1.83) Hz n = 151; TeA, 1.15 (0.35–2.09) Hz n = 48) are not significantly different (U(151,48) = 14 704 p = 0.2 n.s.; Wilcoxon rank-sum test]. Anesthesia induces a significant increase in TeA spontaneous FR (AUDp, U(240,151) = 49 169 p = 0.05 n.s.; TeA, U(97,48) = 6011 p < 1e-4; Wilcoxon rank-sum test Bonferroni corrected for MC). Dashed black lines mark awake population medians, adjacent asterisks mark within region anesthetized versus awake comparisons. B, Evoked FRs in response to BFs [median (IQR): 16.34 (8.17–28.59) Hz n = 132; TeA, 23.69 (14.70–37.58) Hz n = 42]. Evoked FRs in the anesthetized cortex are higher in TeA compared with AUDp (U(132,42) = 10 752 p = 0.005; Wilcoxon rank-sum test). Anesthesia reduced evoked activity in AUDp and raised it in TeA (AUDp, U(164,132) = 27 472 p < 1e-4; TeA, U(55,42) = 2378 p = 0.02; Wilcoxon rank-sum test Bonferroni corrected for MC). C, Bandwidth of SUs in the anesthetized cortex assessed as the number of frequencies at 62 dB SPL evoking a significant response [median (IQR): AUDp, 5.5 (0.5–13.5) n = 132; TeA, 5.5 (0.5–13.5) n = 42]. TeA bandwidth is larger under anesthesia compared with the awake state (AUDp, U(164,132) = 22 784 p = 0.03 n.s.; TeA, U(55,44) = 2188 p = 0.0001; Wilcoxon rank-sum test Bonferroni corrected for MC), and is comparable with bandwidth in AUDp (U(132,42) = 11 507 p = 0.9 n.s.; Wilcoxon rank-sum test). D, Lifetime sparseness of SUs in the anesthetized cortex [median (IQR): AUDp, 0.46 (0.28–0.70) n = 132; TeA, 0.47 (0.34–0.66) n = 42]). Sparseness was similar across regions (U(132,42) = 11,423 p = 0.6 n.s.; Wilcoxon rank-sum test) and lower compared with the awake state (AUDp, U(164,132) = 27,026 p = 0.0003; TeA, U(55,42) = 3298 p < 1e-4; Wilcoxon rank-sum test Bonferroni corrected for MC). E, SU minimal latencies [ML, right column, squares; median (IQR): AUDp, 28 (20–45) ms n = 121; TeA, 39 (30–70) ms n = 37] and latencies to peak [LP, left column, circles; median (IQR): AUDp, 27 (21–42) ms n = 132; TeA, 55 (33–110) ms n = 42] in the anesthetized state. Median values are marked with thick lines. Awake median values are marked with dashed black lines. Both latency parameters were larger in TeA (minimal latency: U(121,37) = 8785 p = 0.0006; latency to peak: U(132,42) = 10 294 p < 1e-4; Wilcoxon rank-sum test); however, on a per region basis, tended to be shorter than for the awake condition (minimal latency: AUDp, U(123,121) = 15 955 p = 0.1 n.s., TeA, U(38,37) = 1518 p = 0.4 n.s.; latency to peak: AUDp, U(164,132) = 27 445 p < 1e-4; TeA, U(55,42) = 3047 p = 0.01; Wilcoxon rank-sum test Bonferroni corrected for MC). F, Normalized population response averaged across pure tone stimuli for excited SUs (AUDp, n = 132; TeA = 42) under anesthesia. Bold lines and shaded regions mark mean response and SEM, respectively (left, blue, AUDp; right, green, TeA). Population responses from the awake condition are shown as dashed lines for comparison. Bottom color bars show p value for comparisons of instantaneous activity to baseline, red lines marking beginning (left) and end (right) of deviation from baseline. Return to baseline activity (AUDp, 171 ms; TeA, 192 ms; paired t test corrected for MC over time bins) was shorter than during wakefulness for both cortices. G, Pairwise SCs in AUDp (blue), TeA (green), and between both regions (AUDp-TeA, brown) under ketamine-domitor anesthesia [median (IQR): AUDp, 0.077 (−0.025−0.220) n = 2915; TeA, 0.133 (−0.018–0.327) n = 196; AUDp-TeA, 0.097 (−0.034–0.238) n = 918]. Correlations were highest in TeA (AUDp vs TeA, U(2915,196) = 4.495e6 p = 0.0009; AUDp vs cross-region, U(2915,918) = 5.572e6 p = 0. 7 n.s.; TeA vs cross-region, U(196,918) = 1.215e5 p = 0.003; Wilcoxon rank-sum test; significant comparisons shown in inset). All distributions were higher than their parallels during wakefulness (shown as dashed histograms; AUDp, U(3042,2915) = 8.491e6 p < 1e-4; TeA, U(529,196) = 1.79e5 p < 1e-4; AUDp-TeA, U(2296,918) = 3.427e6 p < 1e-4; Wilcoxon rank-sum test). All distributions were different from shuffled (p < 1e-4 for all comparisons, Kolmogorov–Smirnoff test). H, Same as G for NCs [median (IQR): AUDp, 0.021 (0.005–0.052) n = 2915; TeA, 0.033 (0.007–0.071) n = 196; AUDp-TeA, 0.022 (0.004−0.051) n = 918]. Correlations were highest in TeA (AUDp vs TeA, U(2915,196) = 4.502e6 p = 0.006; AUDp vs cross-region, U(2915,918) = 5.598e6 p = 0.7 n.s.; TeA vs cross-region, U(196,918) = 1.207e5 p = 0.005; Wilcoxon rank-sum test; significant comparisons shown in inset), and generally larger than in the awake recordings (AUDp, U(3042,2915) = 8.001e6 p < 1e-4; TeA, U(529,196) = 1.771e5 p < 1e-4; AUDp-TeA, U(2296,918) = 3.188e6 p < 1e-4; Wilcoxon rank-sum test). All distributions were different from shuffled (p < 1e-4 for all comparisons, Wilcoxon rank-sum test). I, Scatter plot showing relationship between NCs and SCs. Dashed lines show linear fits for each individual population. Linear correlation between the two was strongest for TeA and for cross region correlations (linear fit, R2: AUDp, NC = 0.14*SC + 0.02 R2 = 0.257; TeA, NC = 0.17*SC + 0.02 R2 = 0.380; TeA-AUDp, NC = 0.17*SC + 0.02 R2 = 0.302).
