
FIGURE 2.
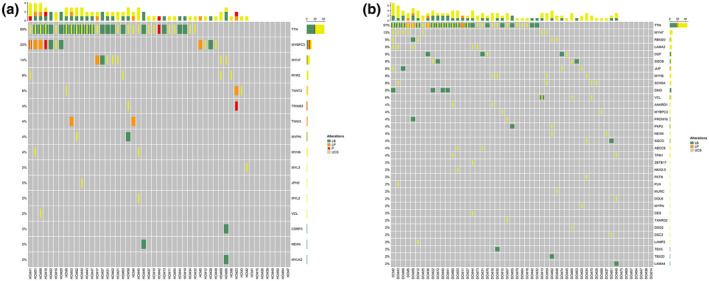
The genetic distribution of variants in HCM cases (a) and DCM cases (b), in genes linked to HCM and DCM, respectively, with respect to variant classification. Each column represents one patient and each row represents one gene. The higher bar at the top summarizes the variants seen in each of the columns