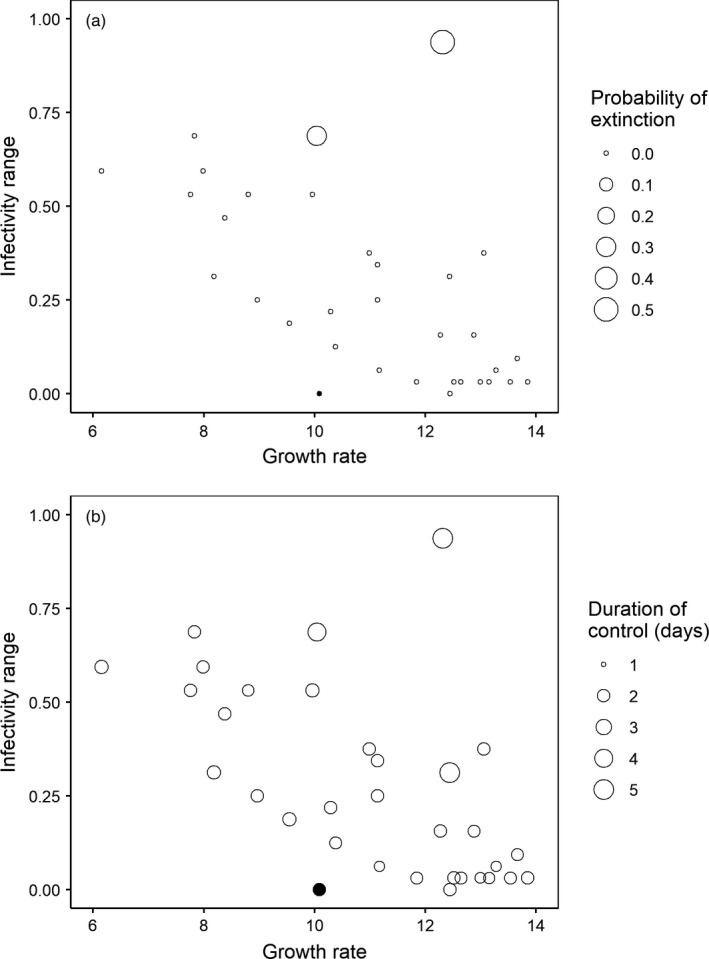
FIGURE 3.

Two estimates of the success of phages in slowing resistance evolution in initially susceptible bacterial populations mapped to point size on the growth–infectivity plot. (a) The probability to drive bacteria extinct. (b) The “duration of effective control” (the period of time before bacteria evolved resistance and showed obvious growth) in assays where phages failed to drive bacterial extinct. The ancestral phage strain is shown here (filled circle) but not included in data analysis
