
Fig. 6.
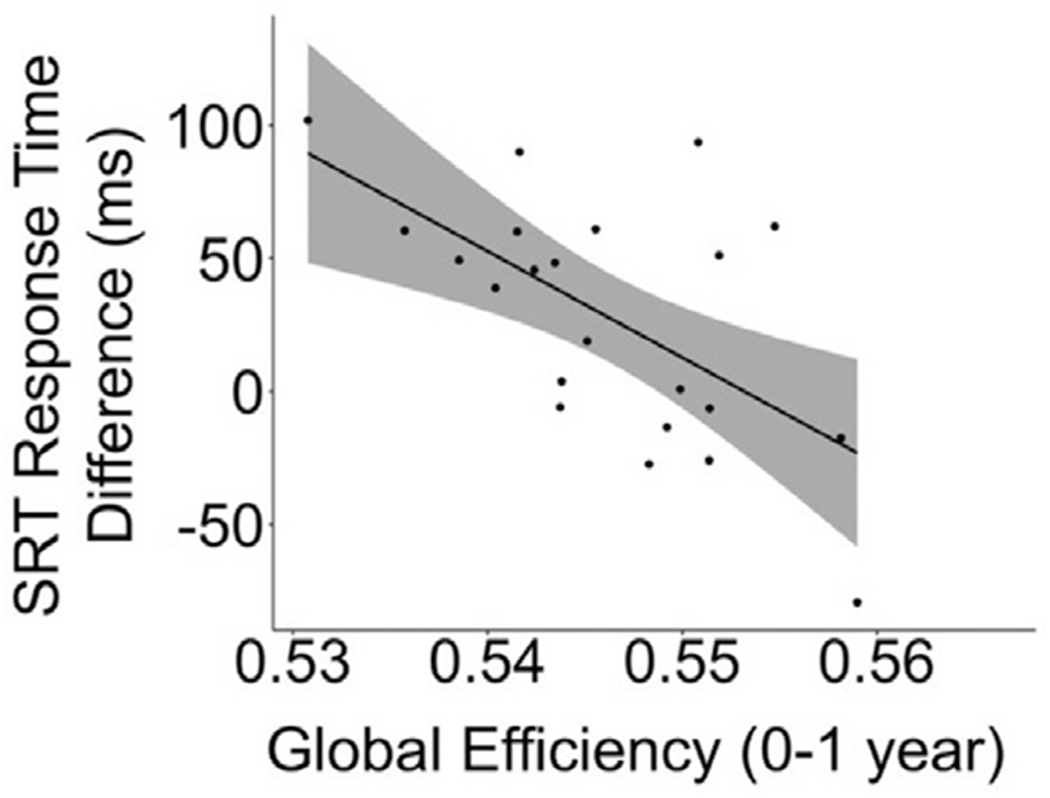
Correlation between sbMCN graph metrics and task performance. There was a negative correlation between global efficiency of early development (0–1 year) sbMCNs and response time difference of the second run of the SRT task (r = −0.606, p-adjusted = 0.022) at 8–10 years. Shading represents 95% confidence intervals, and the trend line represents the line of best fit for this correlation.