. 2021 Jul 15;12(32):10780–10790. doi: 10.1039/d1sc02137k

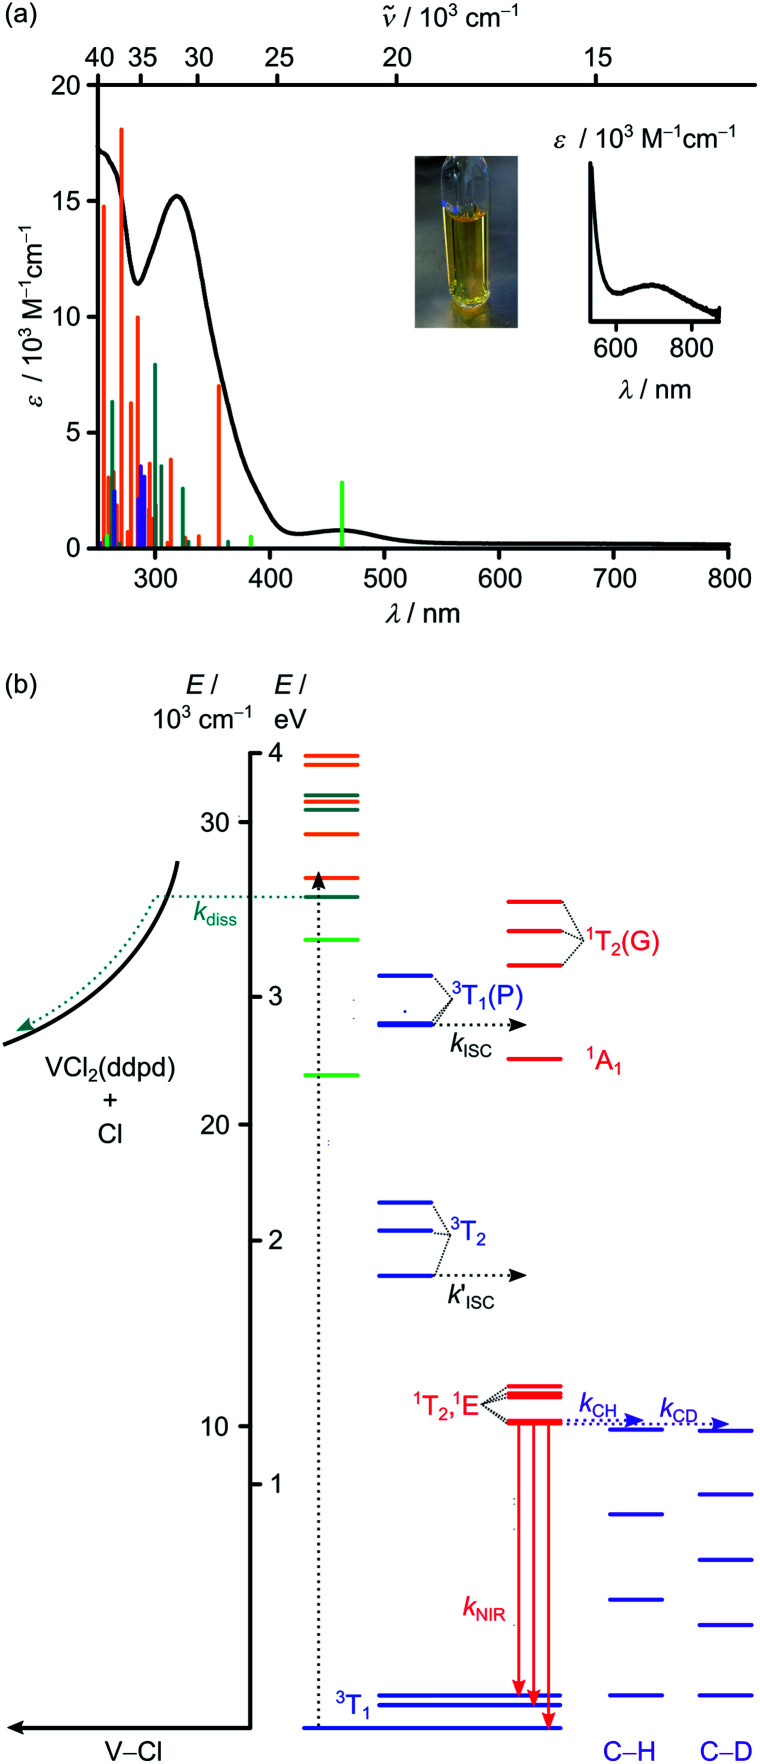
Fig. 1. (a) Absorption spectrum including a zoom into the red spectral region (black) and photograph of VCl3(ddpd-[D0]) in CH3CN. The vertical bars correspond to spin-allowed CT transitions calculated by TDDFT-UKS (hypsochromically shifted by 3400 cm−1). The colour code of the vertical bars indicates the major character of the transition as ddpd → V 3LMCT (light green), Cl → V 3LMCT (petrol green), ILCT (orange) and V → ddpd 3MLCT (purple). (b) Jablonski diagram constructed from TDDFT-UKS (ddpd → V 3LMCT (light green), Cl → V 3LMCT (petrol green) and ILCT (orange)) and CASSCF-NEVPT2 calculations (3MC states in blue; 1MC states in red). Notation of MC states is according to octahedral symmetry. ISC = intersystem crossing; diss = V–Cl homolysis; NIR = NIR emission; C–H and C–D overtones in purple = multiphonon relaxation (experimental overtone energies from ref. 34).

Fig. 1