Figure 4.
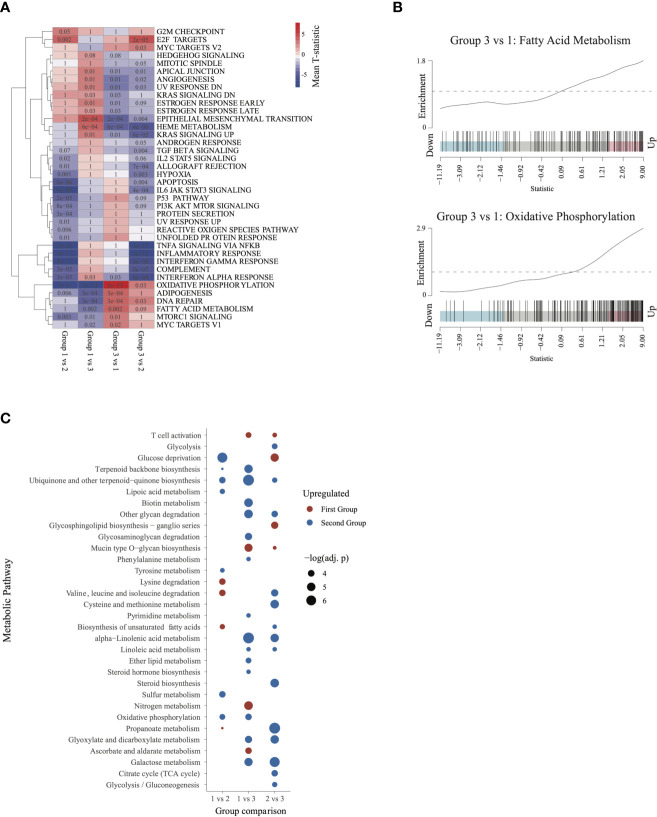
Characterizing the transcriptome of patients in group 3 and group 1: (A) Gene set enrichment analysis heatmap, similar to Figure 2. Pathways significantly dysregulated (q < 0.1) in at least one of the comparisons were included in the heatmap. (B) Barcode plots illustrating upregulation of fatty acid metabolism and oxidative phosphorylation in group 3 relative to group 1 patients. (C) Metabolic pathways differentially activated (q ≤ 0.05) in each of the 3 comparisons. Upregulated pathways are shown in red and downregulated pathways in blue (relative to the second group in each comparison).

