Figure 5.
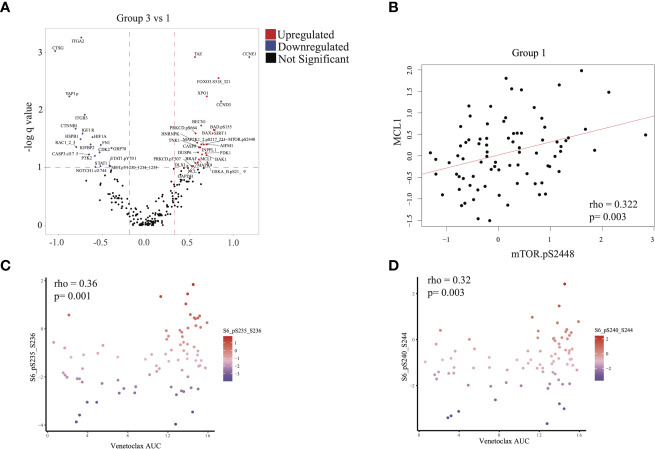
Proteomic analysis: (A) Differential protein expression analysis comparing group 3 with group 1. Upregulated proteins (q < 0.1 and difference in mean > 0.32) are shown in red and downregulated proteins (q < 0.1 and difference in mean > -0.188) in blue. (B) Scatterplot illustrating the correlation between expression of mTOR.pS2448 (activating phosphorylation) and MCL1 (spearman correlation = 0.322, p = 0.003). (C, D) Scatterplot illustrating the expression of phosphorylated S6 (marker of mTOR activation) with venetoclax (higher area under the curve [AUC] indicates more resistance to treatment). Statistics computed using Spearman correlation.

