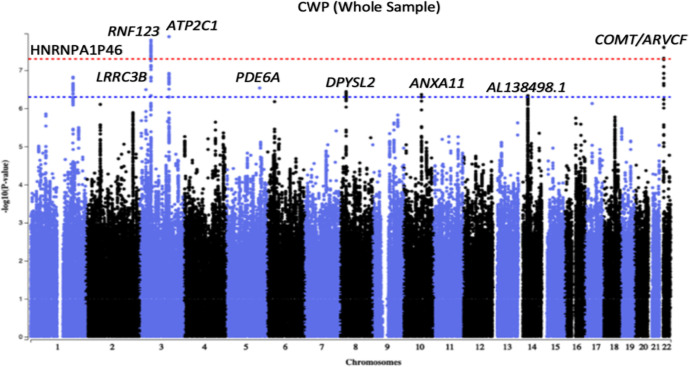
Figure 2.
Manhattan plot of a genome-wide association analysis of chronic widespread musculoskeletal pain (CWP). Each circle in the plot represents a single nucleotide polymorphism (SNP), which was positioned following genomic build GRCh37. The y-axis shows the corresponding –log10 p values and the x-axis shows chromosome position along with SNPs. The horizontal red dotted line indicates genome-wide significance threshold at p=5.0×10⁻⁸. The horizontal blue dotted line indicates suggestive genome-wide significance threshold at p=5.0×10⁻⁷. Gene labels represent nearest genes to independent SNPs located at loci associated with p<5.0×10⁻⁷.

