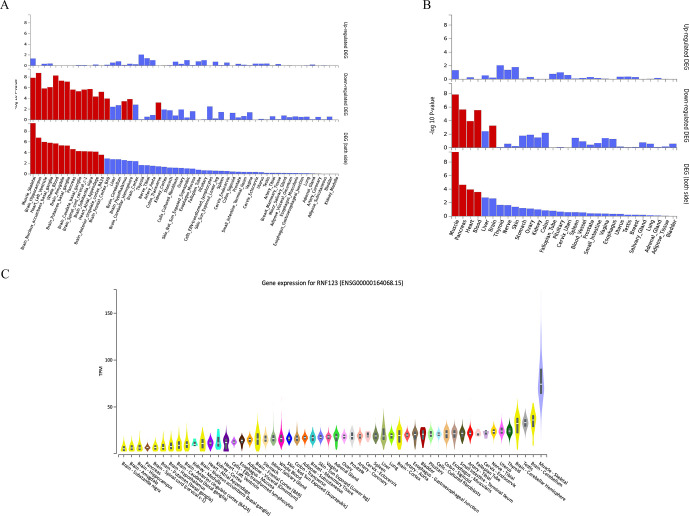
Figure 6.
(A) Differentially expressed gene (DEG) plots for chronic widespread musculoskeletal pain (CWP) in 54 tissue types from GTEX v8, (B) DEG plots for CWP in 30 general tissue types from GTEX v8 and (C) Differential expression of RNF123 gene across tissue types from GTEX v8. (A, B) In both plots, the y-axis represents the ─log10 transformed two-tailed p value of the hypergeometric test. Significantly enriched DEG sets (Bonferroni-corrected p value <0.05) are highlighted in red. (C) Y-axis represents transcripts per million (TPM) and x-axis represents the GTEx (V.8) tissues. The figure was adapted from GTEx portal (https://www.gtexportal.org/home/gene/ENSG00000164068).

