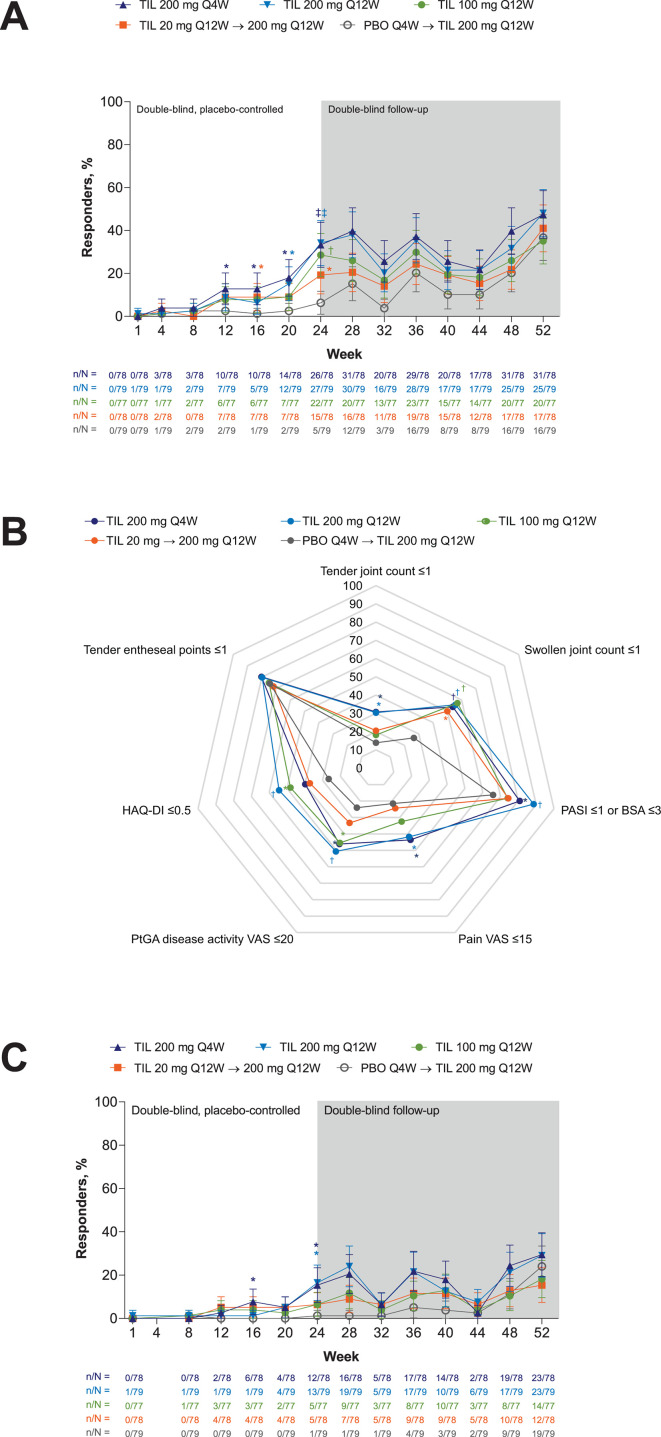
Figure 3.
MDA responders (A) over time, (B) responders for each MDA subcomponent at week 24 and (C) VLDA responders by treatment and time point. Supporting values shown in online supplemental table S4. Shown for randomised patients who received ≥1 dose of study drug. Error bars represent 95% CI. Missing responses were imputed as non-responses. Proportion of responders shown as % in (B). TIL 200 mg Q4W, n=78; TIL 200 mg Q12W, n=79; TIL 100 mg Q12W, n=77; TIL 20 mg Q12W→200 mg Q12W, n=78; PBO Q4W→TIL 200 mg Q12W, n=79 except for tender entheseal points ≤1 in (B) (TIL 200 mg Q4W, n=76; TIL 100 mg Q12W, n=76; PBO Q4W→TIL 200 mg Q12W, n=78).*p<0.05; †p<0.001; ‡p<0.0001 versus PBO; not adjusted for multiplicity. P values were not analysed beyond week 24. BSA, body surface area; HAQ-DI, Health Assessment Questionnaire-Disability Index; MDA, Minimum Disease Activity; PASI, Psoriasis Area and Severity Index; PBO, placebo; PtGA, patients global assessment; Q4W, every 4 weeks; Q12W, every 12 weeks; TIL, tildrakizumab; VAS, visual analogue scale; VLDA, very low disease activity.

