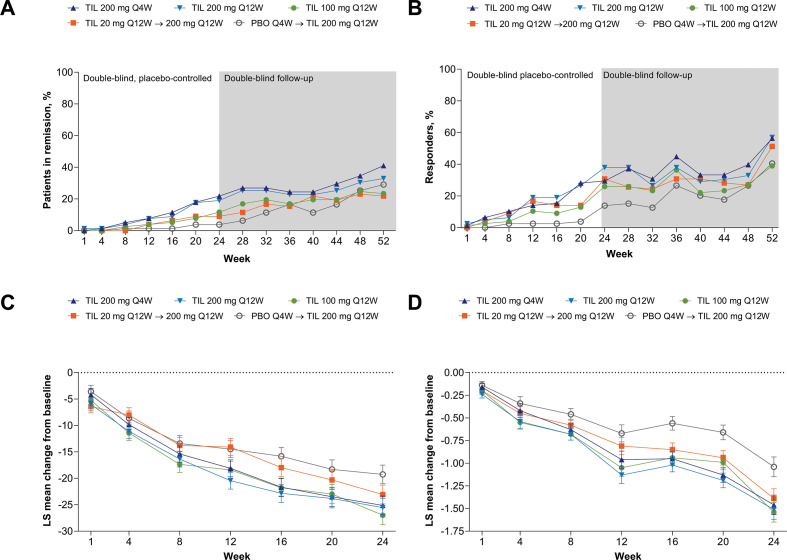
Figure 5.
Proportion of patients in remission based on (A) DAPSA, proportion of patients with PASDAS <3.2 (B), and change from baseline DAPSA (C) and PASDAS (D). Supporting values shown in online supplemental table S5. Missing responses were imputed as non-responses. DAPSA remission was defined as a score between 0 and 4. TIL 200 mg Q4W, n=78; TIL 200 mg Q12W, n=79; TIL 100 mg Q12W, n=77; TIL 20 mg Q12W→200 mg Q12W, n=78; PBO Q4W→TIL 200 mg Q12W, n=79. P values not analysed. DAPSA, Disease Activity in Psoriatic Arthritis; LS, least squares; PASDAS, Psoriatic Arthritis Disease Activity Score; PBO, placebo; Q4W, every 4 weeks; Q12W, every 12 weeks; TIL, tildrakizumab.

