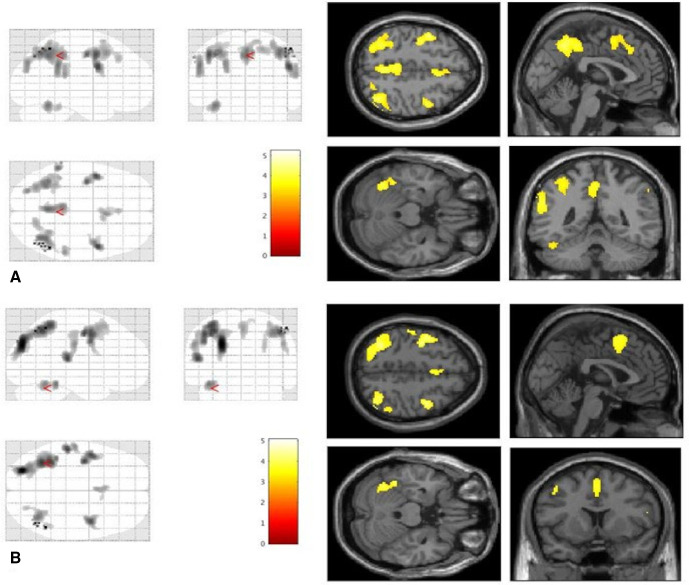
Figure 1.
Areas of increased regional cerebral blood flow in patients with visual snow syndrome (n=24) compared to healthy controls (n=24) when looking at a blank screen at baseline (A) and when observing a ‘snow-like’ visual stimulus (B). All areas are significant at the cluster level whole-brain analyses and corrected for cluster extent. Bars represent T values.

