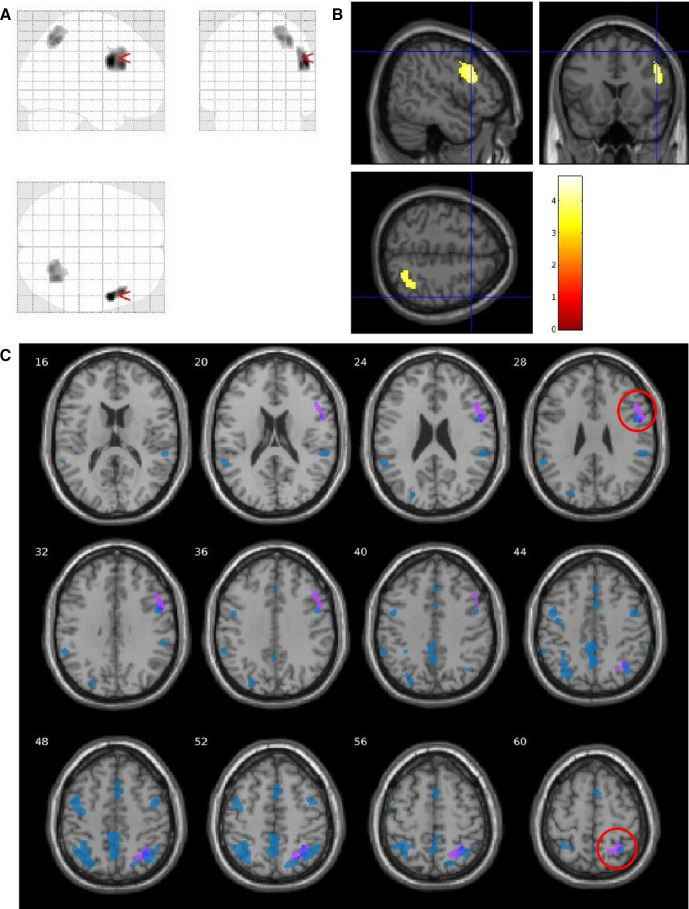
Figure 4.
Analysis comparing visual snow syndrome (VSS) patients versus migraine patients versus healthy controls (Ctrls), showing two clusters of increased regional cerebral blood flow in VSS patients imposed over a glass brain (A) and standard T1 image (B). Clusters are located in the right precentral gyrus (x=54, y=6, z=28; T=4.40; k =420; p=0.001) and right precuneus (x=34, y=−56, z=50; T=4.04; k=404; p=0.001). A comparative image (C) with the whole-brain analysis between VSS patients and Ctrls shows that the two clusters overlap the significant areas previously found. SVC, small volume correction.

