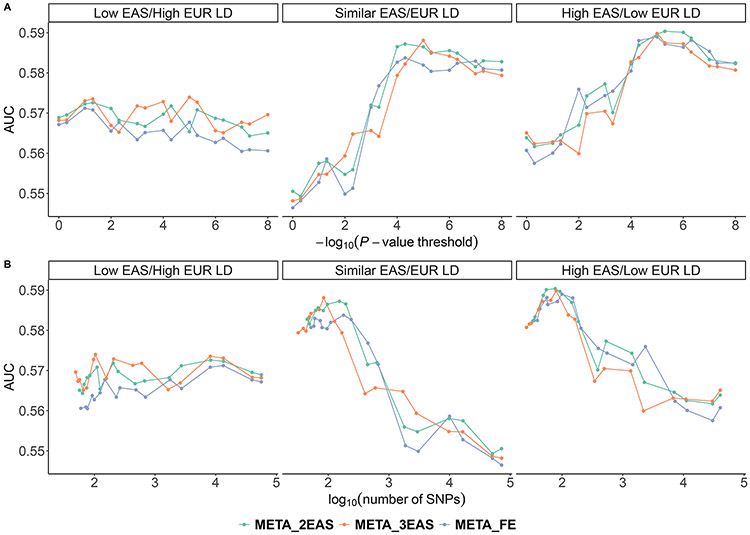
Fig 4.
The AUC of PRSs constructed with SNPs in different ldiff groups. All SNPs were classified into three groups: low EAS/high EUR LD score group with ldiff less than its 33% quantile, similar EAS/EUR LD score group with ldiff between its 33% and 67% quantiles, and high EAS/low LD score group with ldiff larger than its 67% quantile. META_FE denotes the conventional fixed-effect meta-analysis; META_2EAS denotes the rescaled meta-analysis that upweights the EAS effect size estimates by a factor of two; and META_3EAS denotes the rescaled meta-analysis that upweights the EAS effect size estimates by a factor of three. Each PRS was plotted against the (A) P-value threshold and (B) number of SNPs.

