. 2021 Jul 21;12(32):10901–10918. doi: 10.1039/d1sc03486c

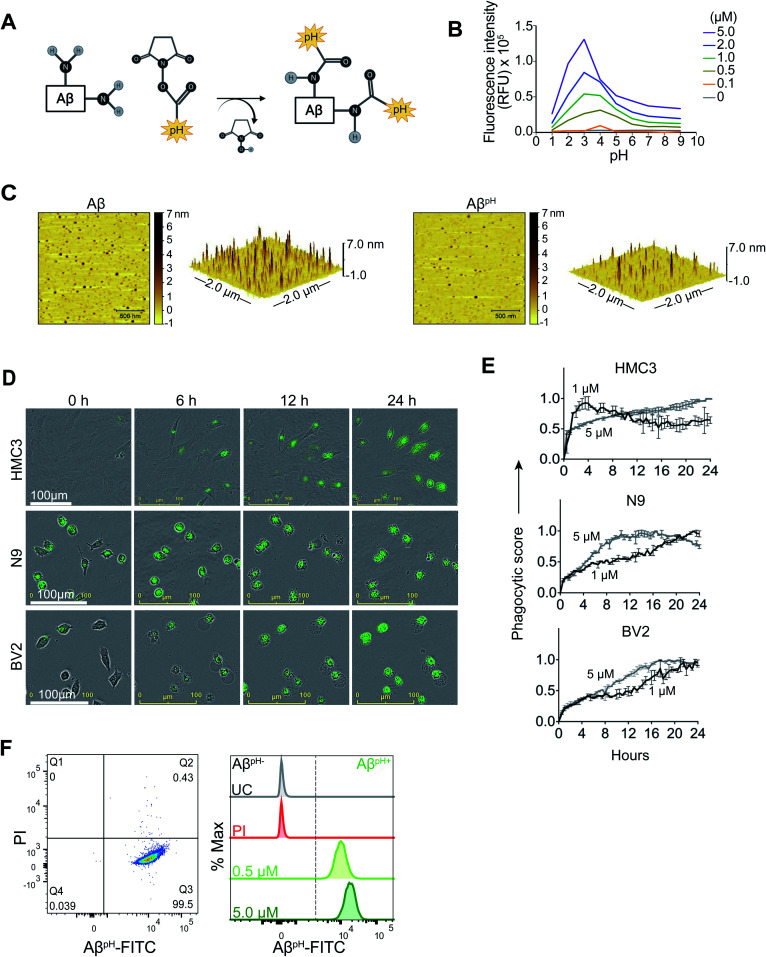
Fig. 1. Synthesis and characterization of AβpH. (A) The AβpH is synthesized by conjugating the amine-reactive pH-sensitive Protonex Green dye to the side chain amine groups of the lysine residues and the N-terminal of human Aβ1–42 peptide. (B) The pH-sensitivity of the AβpH probe characterized at different concentrations from 0.1 μM to 5.0 μM. Increased fluorescence is observed at acidic pH values of ∼5.0 to ∼2.0, covering the pH range of the intracellular acidic organelles. (C) Atomic force microscopy topographic images of AβpH oligomers compared to synthetic Aβ oligomers. Left-2D topographic image of AβpH and synthetic Aβ oligomers. Right-3D image (2 × 2 μm xy). (D) Live cell imaging of the phagocytic uptake of 1 μM AβpH by BV2 and N9 mouse microglia and by HMC3 human microglia over 24 hours. (E) Quantification of AβpH phagocytic score by BV2, N9, and HMC3 microglial cells from the live cell images. (F) The phagocytic uptake of AβpH by BV2 cells is measured and quantified via flow cytometry analysis. Dot plot shows live (PI) and AβpH+ cells. No green fluorescence is measured in unstained cells (UC) and in dead cells stained with the PI only whereas green fluorescence is measured in cells treated with 0.5 and 5.0 μM AβpH for 1 hour (higher fluorescence is seen in cells exposed to the higher concentration of AβpH). Data shown in terms of % max, by scaling each curve to mode = 100% (y-axis).

Fig. 1