. 2021 Jul 21;12(32):10901–10918. doi: 10.1039/d1sc03486c

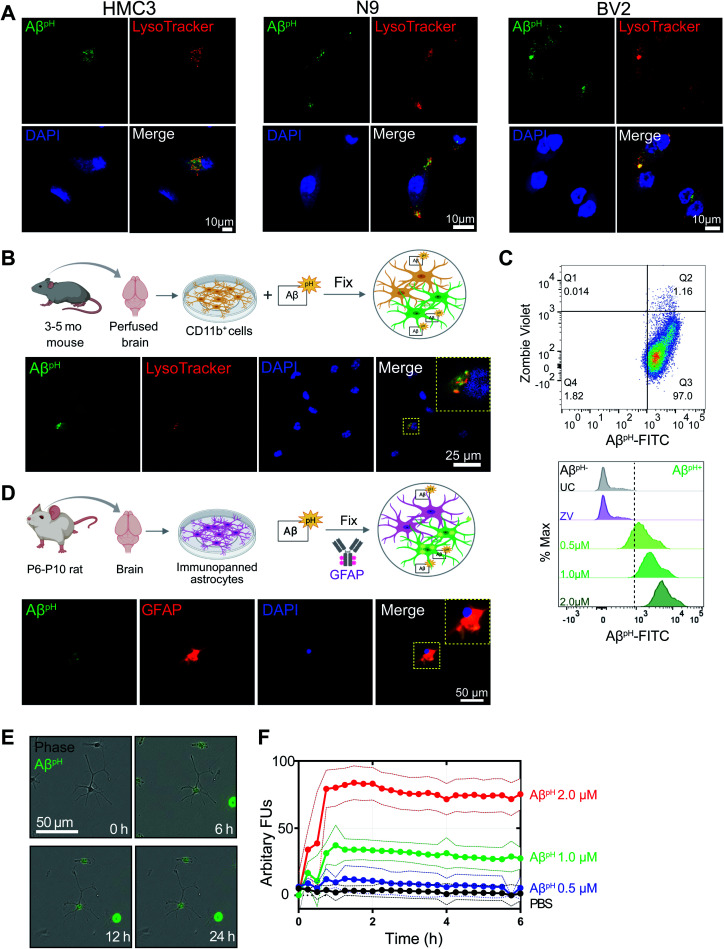
Fig. 2. Fluorescence of internalized AβpH is retained in fixed cells. (A) Confocal images of fixed HMC3, N9, and BV2 cells showing the uptake of AβpH (green). Cells are stained for acidic intracellular organelles (LysoTracker Red, confirming co-localization of the AβpH within the acidic intracellular organelles) and nuclei (DAPI, blue). No antibody is required to detect AβpH. (B) Primary mouse microglia grown in defined, reduced-serum media phagocytose AβpHex vivo. Cells are fixed and stained for nuclei and show AβpH colocalized in the acidic organelles with LysoTracker Red. (C) The phagocytic uptake of AβpH by primary microglia is measured and quantified via flow cytometry analysis. Dot plot shows live (ZV) and AβpH+ cells. No green fluorescence is measured in unstained cells (UC) or dead cells stained with the ZV live/dead stain only whereas green fluorescence is measured in cells treated with 0.5, 1.0, and 2.0 μM AβpH for 1 hour. Data shown in terms of % max, by scaling each curve to mode = 100% (y-axis). (D) Primary immunopanned rat astrocytes also phagocytose AβpH in serum-free conditions. Cells are fixed and stained for astrocyte specific GFAP antibody (red) and nuclei. (E) Uptake of AβpH over time by primary immunopanned astrocytes as observed in live cells in real time. (F) Quantification of uptake of 0.5, 1.0, and 2.0 μM AβpH by primary astrocytes. Data are mean ± SEM, n = 8 separate wells per group/timepoint.

Fig. 2