. 2021 Jul 13;12(32):10848–10854. doi: 10.1039/d1sc01760h

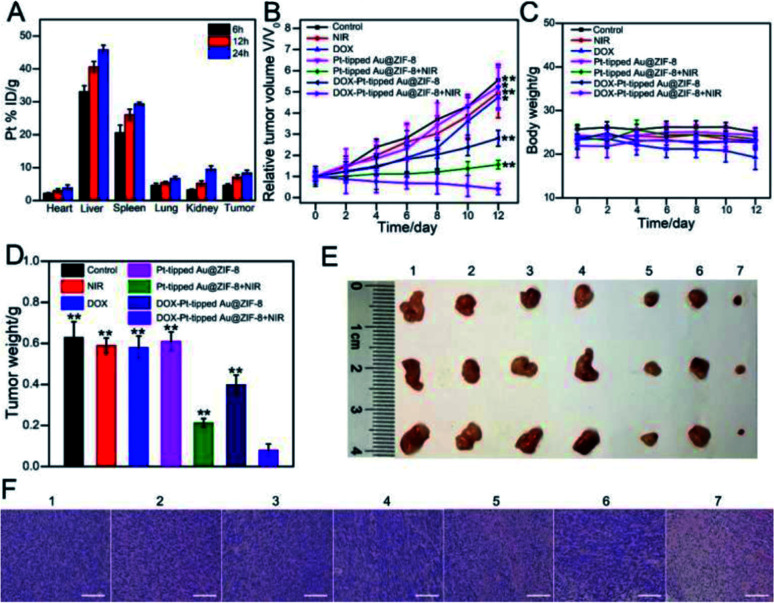
Fig. 5. (A) The biodistribution of Pt in tumors and main organs of mice after intravenous injection with DOX-Pt-tipped Au@ZIF-8 at different time intervals. Relative tumor volume growth curves (B), body weight curves (C) and tumor weights (D) of the 4T1 tumor-bearing mice with various treatments (**p < 0.01, *p < 0.05). (E) Photographs of tumors collected from tumor-bearing mice at the end of every different treatment. (F) H&E staining images of tumor sections in each group. Group 1: PBS. Group 2: NIR-II laser irradiation. Group 3: DOX. Group 4: Pt-tipped Au@ZIF-8. Group 5: Pt-tipped Au@ZIF-8 + 1064 nm laser irradiation. Group 6: DOX-Pt-tipped Au@ZIF-8. Group 7: DOX-Pt-tipped Au@ZIF-8 + 1064 nm laser irradiation. Scale bar: 100 μm.

Fig. 5