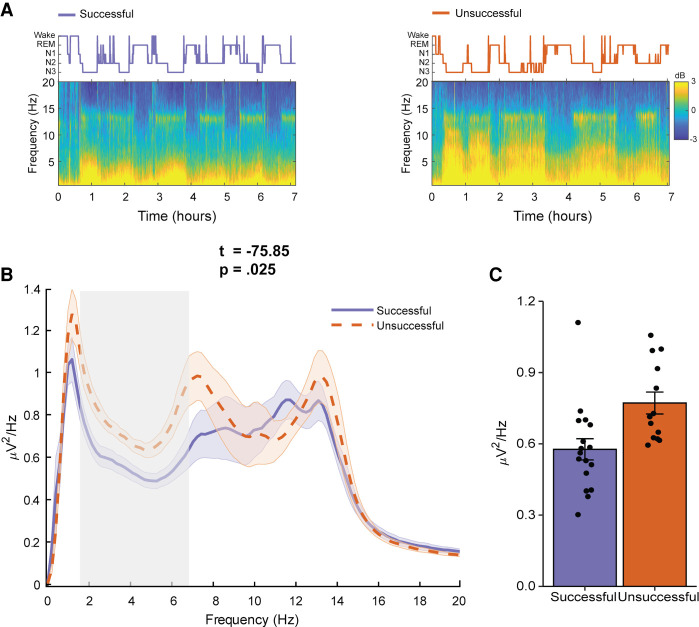
Figure 3.
Spectral power analysis. (A) Hypnogram (top) and full night spectrogram (bottom) at electrode C4 of a single participant who did successfully remember the prospective memory intention (left) and a single participant who did not successfully remember the prospective memory intention (right). (B) Group-level SWS power spectrum (averaged power across frontal and central electrodes). Power spectral density (PSD) was normalized within each participant by dividing power at each frequency bin by the average PSD in the 0–20 Hz range. The gray box highlights frequencies in which there were significant differences between participants who remembered the prospective memory intention (solid purple line) and participants who did not remember the prospective memory intention (dashed orange line). Cluster statistic displayed above plot. Shaded areas indicate the standard error. (C) PSD averaged across frequencies in the significant cluster (B) for successful and unsuccessful participants. Error bars indicate the standard error.

