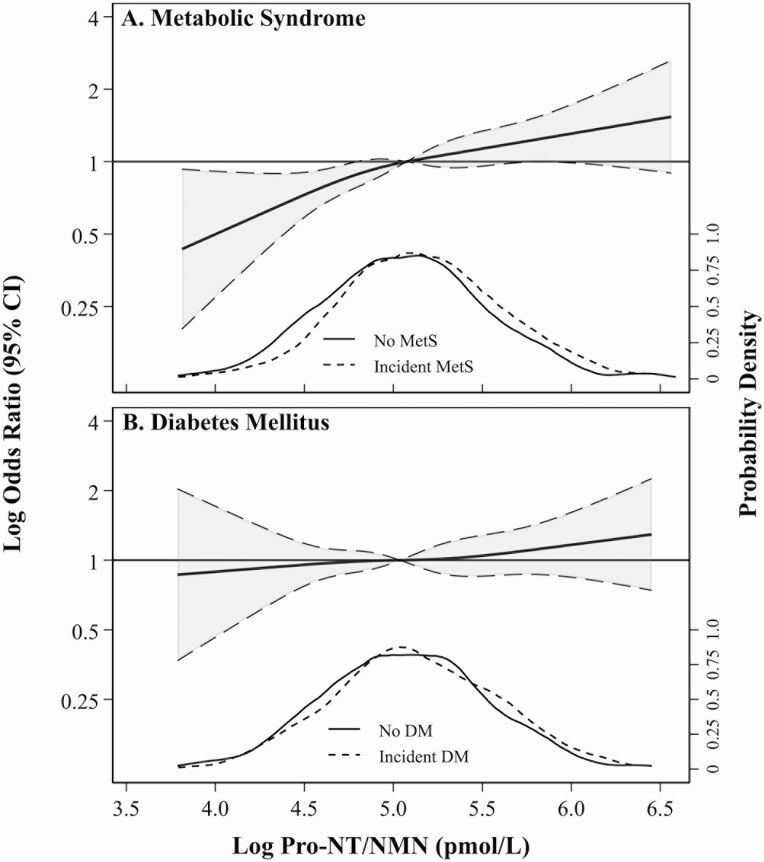
Figure 3.
Restricted cubic splines presenting odds ratios (OR) and 95% CI (shaded) of incident A, metabolic syndrome (MetS) and B, diabetes mellitus (DM) across log pro-neurotensin/neuromedin N (pro-NT/NMN) considering age, race, and sex as covariates (model 1). Each spline references the subgroup-specific median and uses knots specified by Harrell’s method, set at 4.3, 4.9, 5.3, and 5.9 pmol/L (MetS); and 4.3, 4.9, 5.2, and 5.8 pmol/L (DM). Spline functions were cut at the subsample-specific 0.5th and 99.5th percentiles of log pro-NT/NMN. Kernel density plots show distributions of pro-NT/NMN within each subgroup, stratified by participants without (solid) and with (dashed) incident MetS or DM.

