Figure 2.
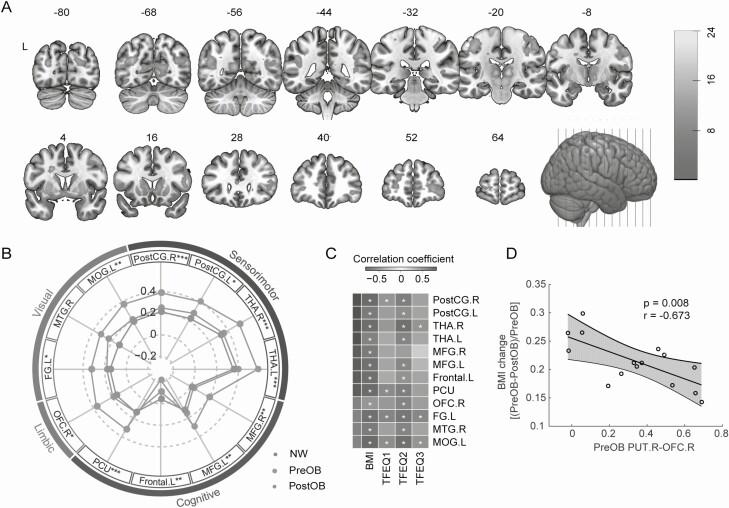
Brain-wide functional connectivity with right putamen is restored after VSG. (A) Seed-based analysis of the right putamen revealed brain-wide alterations of functional connectivity (FDR corrected). Color bar indicates t values. (B) Radar plot shown the comparisons of altered functional connectivity with the right putamen shown in (A) among obese groups and NW (PreOB, n = 33; PostOB, n = 16; NW, n = 25). Involved brain regions are grouped according to 4 putative neural circuits (color-coded) that may regulate eating habits. Asterisks denote significance levels between NW and PreOB (*P < 0.05; **P < 0.01; ***P < 0.001). (C) Correlation heatmap of changes in the right putamen-centered connectivity with BMI and TFEQ subscores (PreOB, n = 16; PostOB, n = 16). Red and blue colors indicate positive and negative correlation coefficients. Symbols denote significance levels of the correlations (+q < 0.05; *q < 0.01). The reported q-values here were FDR corrected for multiple comparisons. (D) Preoperative functional connectivity between PUT.R and OFC.R was significantly correlated with changes in BMI scores in patients with obesity (n = 16). Shaded areas indicate 95% CI. Abbreviations: FG.L, left fusiform gyrus; Frontal.L, white matter area in left frontal lobe; MFG.L, left middle frontal gyrus; MFG.R, right middle frontal gyrus; MOG.L, left middle occipital gyrus; MTG.R, right middle temporal gyrus; OFC.R, right orbitofrontal cortex; PCU, Precuneus; PostCG.L, left postcentral gyrus; PostCG.R, right postcentral gyrus; THA.L, left thalamus; THA.R, right thalamus.

