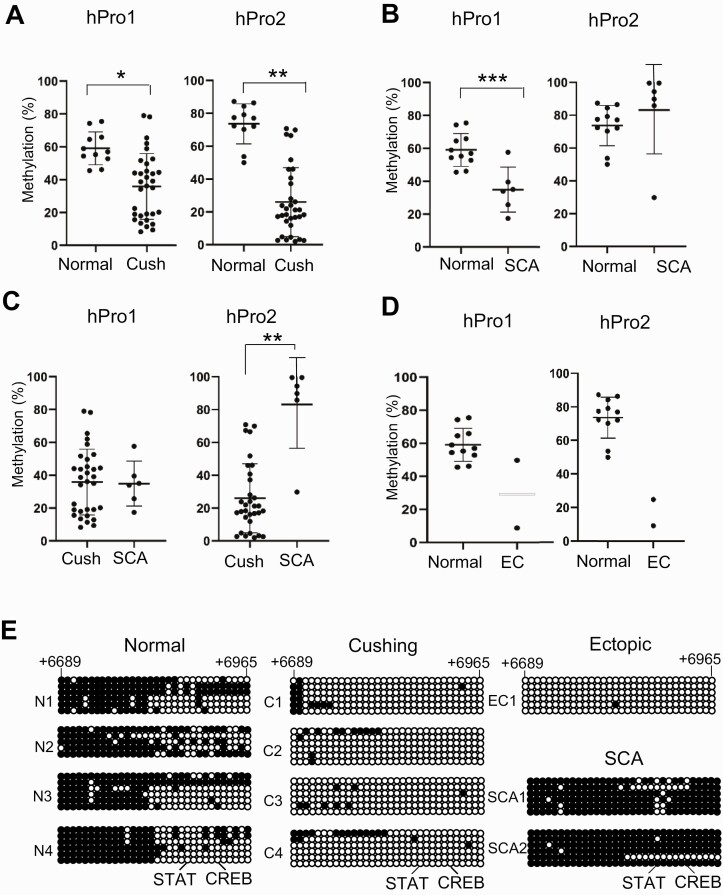
Figure 5.
DNA methylation of first and second promoters. A to D, DNA methylation in the proopiomelanocortin (POMC) first (hPro1) and second (hPro2) promoters analyzed by bisulfite-conversion–based methylation-specific polymerase chain reaction using DNA isolated from 11 normal autopsy-derived pituitaries (normal), 32 pituitary adrenocorticotropin (ACTH)-secreting tumors (Cush), 2 ectopic ACTH-secreting tumors (EC), and 6 silent corticotroph adenomas (SCA). Results were compared between A, normal and Cush; B, normal and SCA; C, Cush and SCA; and D, normal and EC. *P = .001; **P < .001; ***P = .008. E, CpG methylation sites in the POMC second promoter were analyzed by bisulfate sequencing using DNA isolated from 4 normal pituitary (N1-4), 4 pituitary ACTH-secreting tumors (C1-4), 1 ectopic ACTH-secreting tumor (EC1), and 2 SCAs (SC1,2). Circles indicate potential methylation sites in the dinucleotide 5′-CG-3′ (CpG) island at +6689 to +6965. The DNA sequence of the CpG island is shown in Fig. 1C. Positions of STAT and CREB binding sequences are indicated. Open and closed circles indicate demethylated and methylated sites, respectively. Tumor characteristics are shown in Tables 2 and 3.

