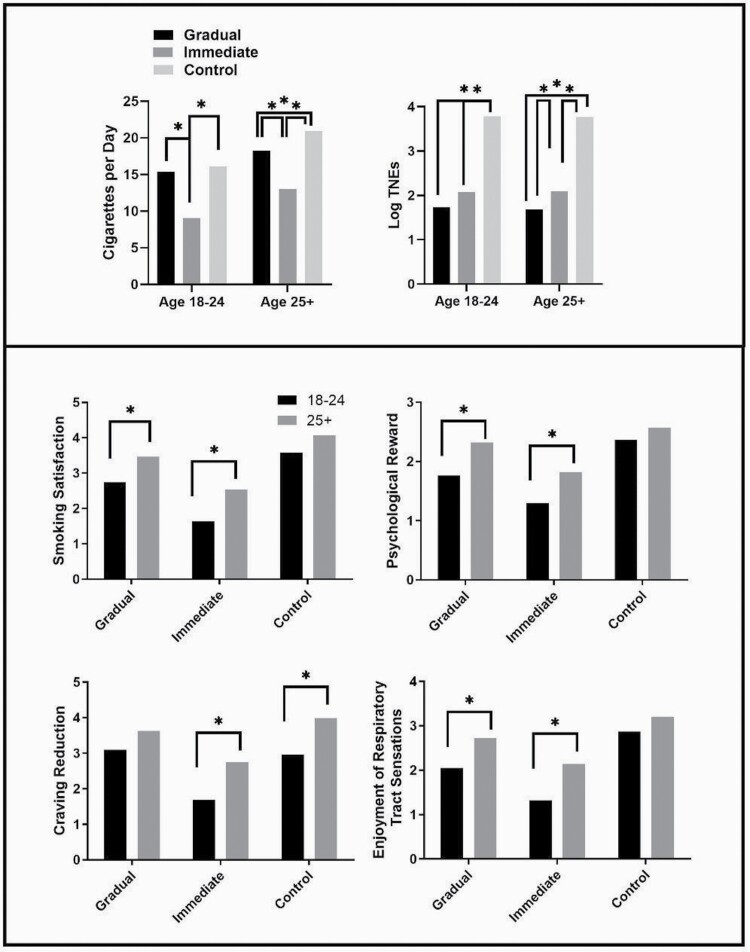
Figure 1.
Mean predicted values from all outcome variables with any significant differences at Week 20. The top panel shows treatment effects across age groups on primary outcomes; the lower panel shows comparisons within condition across age groups on subjective effects. Asterisks represent a significant mean difference.

