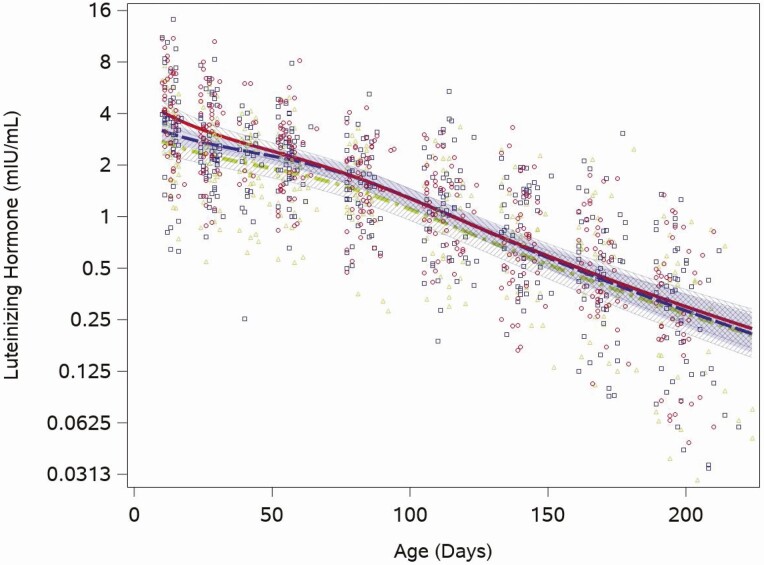
Figure 2.
Feeding group–specific fitted LH trajectories across infant age. Trajectories for soy formula fed infants are represented by the red solid line, cow milk formula–fed infants are represented by the blue long-dashed line, and breastfed infants are represented by the green dot-dashed line. Open symbols represent individual LH concentrations for infants in the study; red circles for soy formula fed infants, blue squares for cow milk formula–fed infants, and green triangles for breastfed infants. Shaded bands represent 95% confidence intervals for each feeding group–specific trajectory: soy formula fed, diagonal upward to the right; cow milk formula fed, solid gray; breastfed, diagonal downward to the right.

